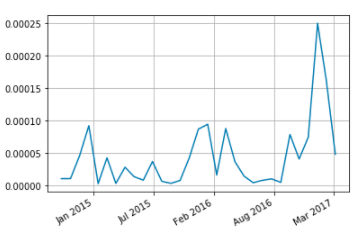
Compute Maximum Precipitation to Find High Precipitation Events
Download the Jupyter Notebook file here
# Compute Max to Find High Precipitation Events
import cwt, os
class TestWorkflow:
plotter = cwt.initialize()
host ="https://edas.nccs.nasa.gov/wps/cwt"
wps = cwt.WPS( host, log=True,log_file=os.path.expanduser("~/esgf_api.log"), verify=False )
def spatial_max( self ):
# Set the domain to be Hawaii to San Francisco, from December 15, 2014 to December 20, 2017
domain_data = { 'id': 'd0', 'lat': {'start':-90, 'end':90,'crs':'values'},
'lon': {'start':0, 'end':360, 'crs':'values'},
'time':{'start':'2014-09-01T00:00:00', 'end':'2017-03-31T23:00:00', 'crs':'timestamps'}}
d0 = cwt.Domain.from_dict(domain_data)
# Set the input data to be 6 hourly CFSR precipition data (variable pr)
inputs = cwt.Variable("collection://cip_cfsr_6hr", "pr",domain=d0 )
# Set the operation to be "maximum" operating over the xy axes
op_data = { 'name': "xarray.max", 'axes': "xy" }
op = cwt.Process.from_dict( op_data )
op.set_inputs( inputs )
# Set the operation to be "sum" operating over the time axes
op_data1 = { 'name': "xarray.sum", 'axes': "t" }
op1 = cwt.Process.from_dict( op_data1 )
op1.set_inputs( inputs )
self.wps.execute( op, domains=[d0], async=True )
dataPaths_max = self.wps.download_result(op)
self.wps.execute( op1, domains=[d0], async=True )
dataPaths_sum = self.wps.download_result(op1)
# Plot both a precitation vs time and a precipitation over the spatial range plot
for dataPath in dataPaths_max:
self.plotter.mpl_timeplot(dataPath)
for dataPath in dataPaths_sum:
self.plotter.mpl_spaceplot(dataPath)
executor = TestWorkflow()
executor.spatial_max()