NCCS Enables High-Resolution
Elevation Maps of Moon’s South Pole
This video shows the movement of shadows near the Moon's South Pole over the course of two lunar days, which is approximately two months on Earth. The visualization was created from data gathered by NASA’s Lunar Reconnaissance Orbiter spacecraft. Visualization by Ernie Wright, NASA Scientific Visualization Studio (SVS)/USRA. Video produced by David Ladd, NASA Goddard/USRA. Music provided by Universal Production Music: “Two Horizons” – Anthony d’Amario.
NASA Center for Climate Simulation (NCCS) resources enabled scientists from NASA Goddard Space Flight Center, the Massachusetts Institute of Technology (MIT), and Brown University to create new high-resolution elevation maps of four potential NASA Artemis mission landing sites near the Moon’s South Pole.

Michael Barker
“NASA plans to send robotic and human explorers to the South Pole of the Moon in the next 5 years,” said Michael Barker, Research Space Scientist in NASA Goddard’s Planetary Geology, Geophysics, & Geochemistry Laboratory. Barker led the research team, who published their results in the journal Planetary and Space Science.
The South Pole presents both promise and challenge for future NASA missions. Most notable are the region’s extreme lighting and temperature conditions. Permanently shadowed regions inside craters have temperatures reaching below -173°C (-280°F), making them “cold traps” for volatiles including water in the form of ice. These volatiles could provide critical natural resources for long-term lunar outposts.
On the other hand, “favorable illumination conditions are important to ensure that there is enough sunlight available to power landed assets and infrastructure, such as static landers, rovers, science instruments, communication systems, human life support systems, etc.,” Barker said. Well-lit, tall peaks provide the right illumination conditions, and, intriguingly, some of the South Pole’s permanently shadowed regions lie near such peaks.
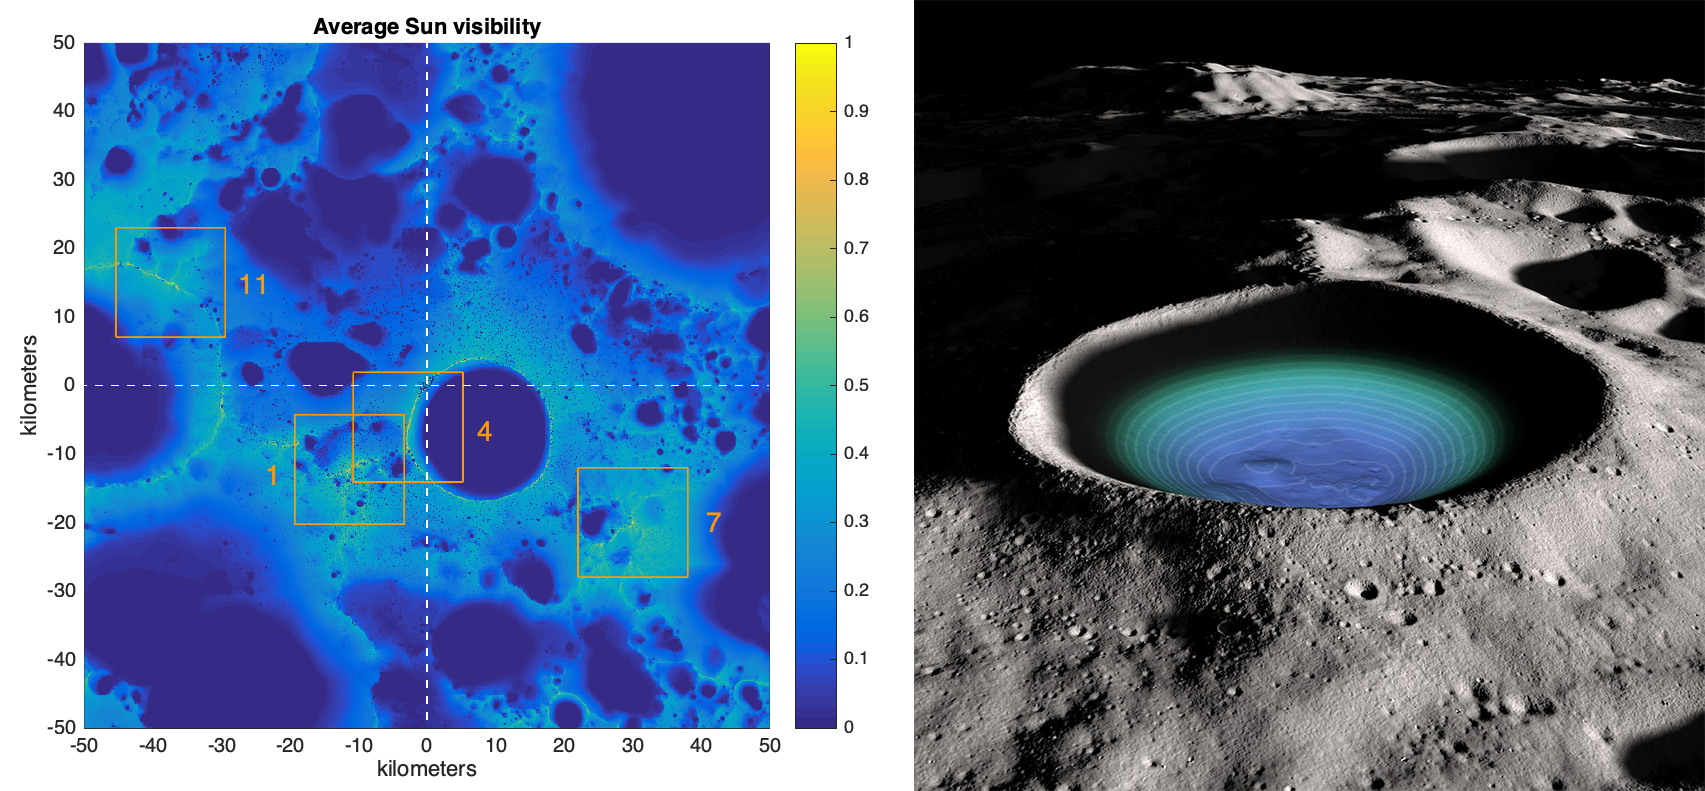
Left: Average illumination of the Sun at the lunar South Pole over a full 18.6-year precession cycle. The four numbered boxes outline the 16 × 16-kilometer regions for which the researchers derive new digital elevation models and study illumination conditions. Figure by Michael Barker, NASA Goddard.
Right: A visualization of the lunar South Pole’s Shackleton crater, with color coding and contoured elevation to illuminate the crater floor. Site 1 is the connecting ridge between Shackleton crater and de Gerlache crater to the upper right. Site 4 is on the rim of Shackleton. Site 11 is on the rim of de Gerlache. Site 7 (not visible) is an isolated peak near Shackleton on the far side. The Earth-facing side of the Moon is to the right. Research by Erwan M. Mazarico, Gregory A. Neumann, and David Smith, NASA Goddard; and Maria Zuber, MIT. Visualization by Ernie Wright, NASA SVS/USRA.
Given this complex South Pole landscape, “NASA lunar missions require accurate, precise, and high-resolution maps of surface height and slope both outside and inside permanently shadowed regions on lander-relevant scales,” Barker stressed.
One instrument capable of accomplishing that feat is the Lunar Orbiter Laser Altimeter (LOLA) onboard NASA’s Lunar Reconnaissance Orbiter (LRO). LOLA works by shooting a laser at the surface of the Moon and measuring how long it takes for the light to bounce back. While not limited by darkness, LOLA does have its drawbacks: errors in LRO orbit reconstruction and gaps between ground tracks and laser spots can lead to surface height uncertainty.
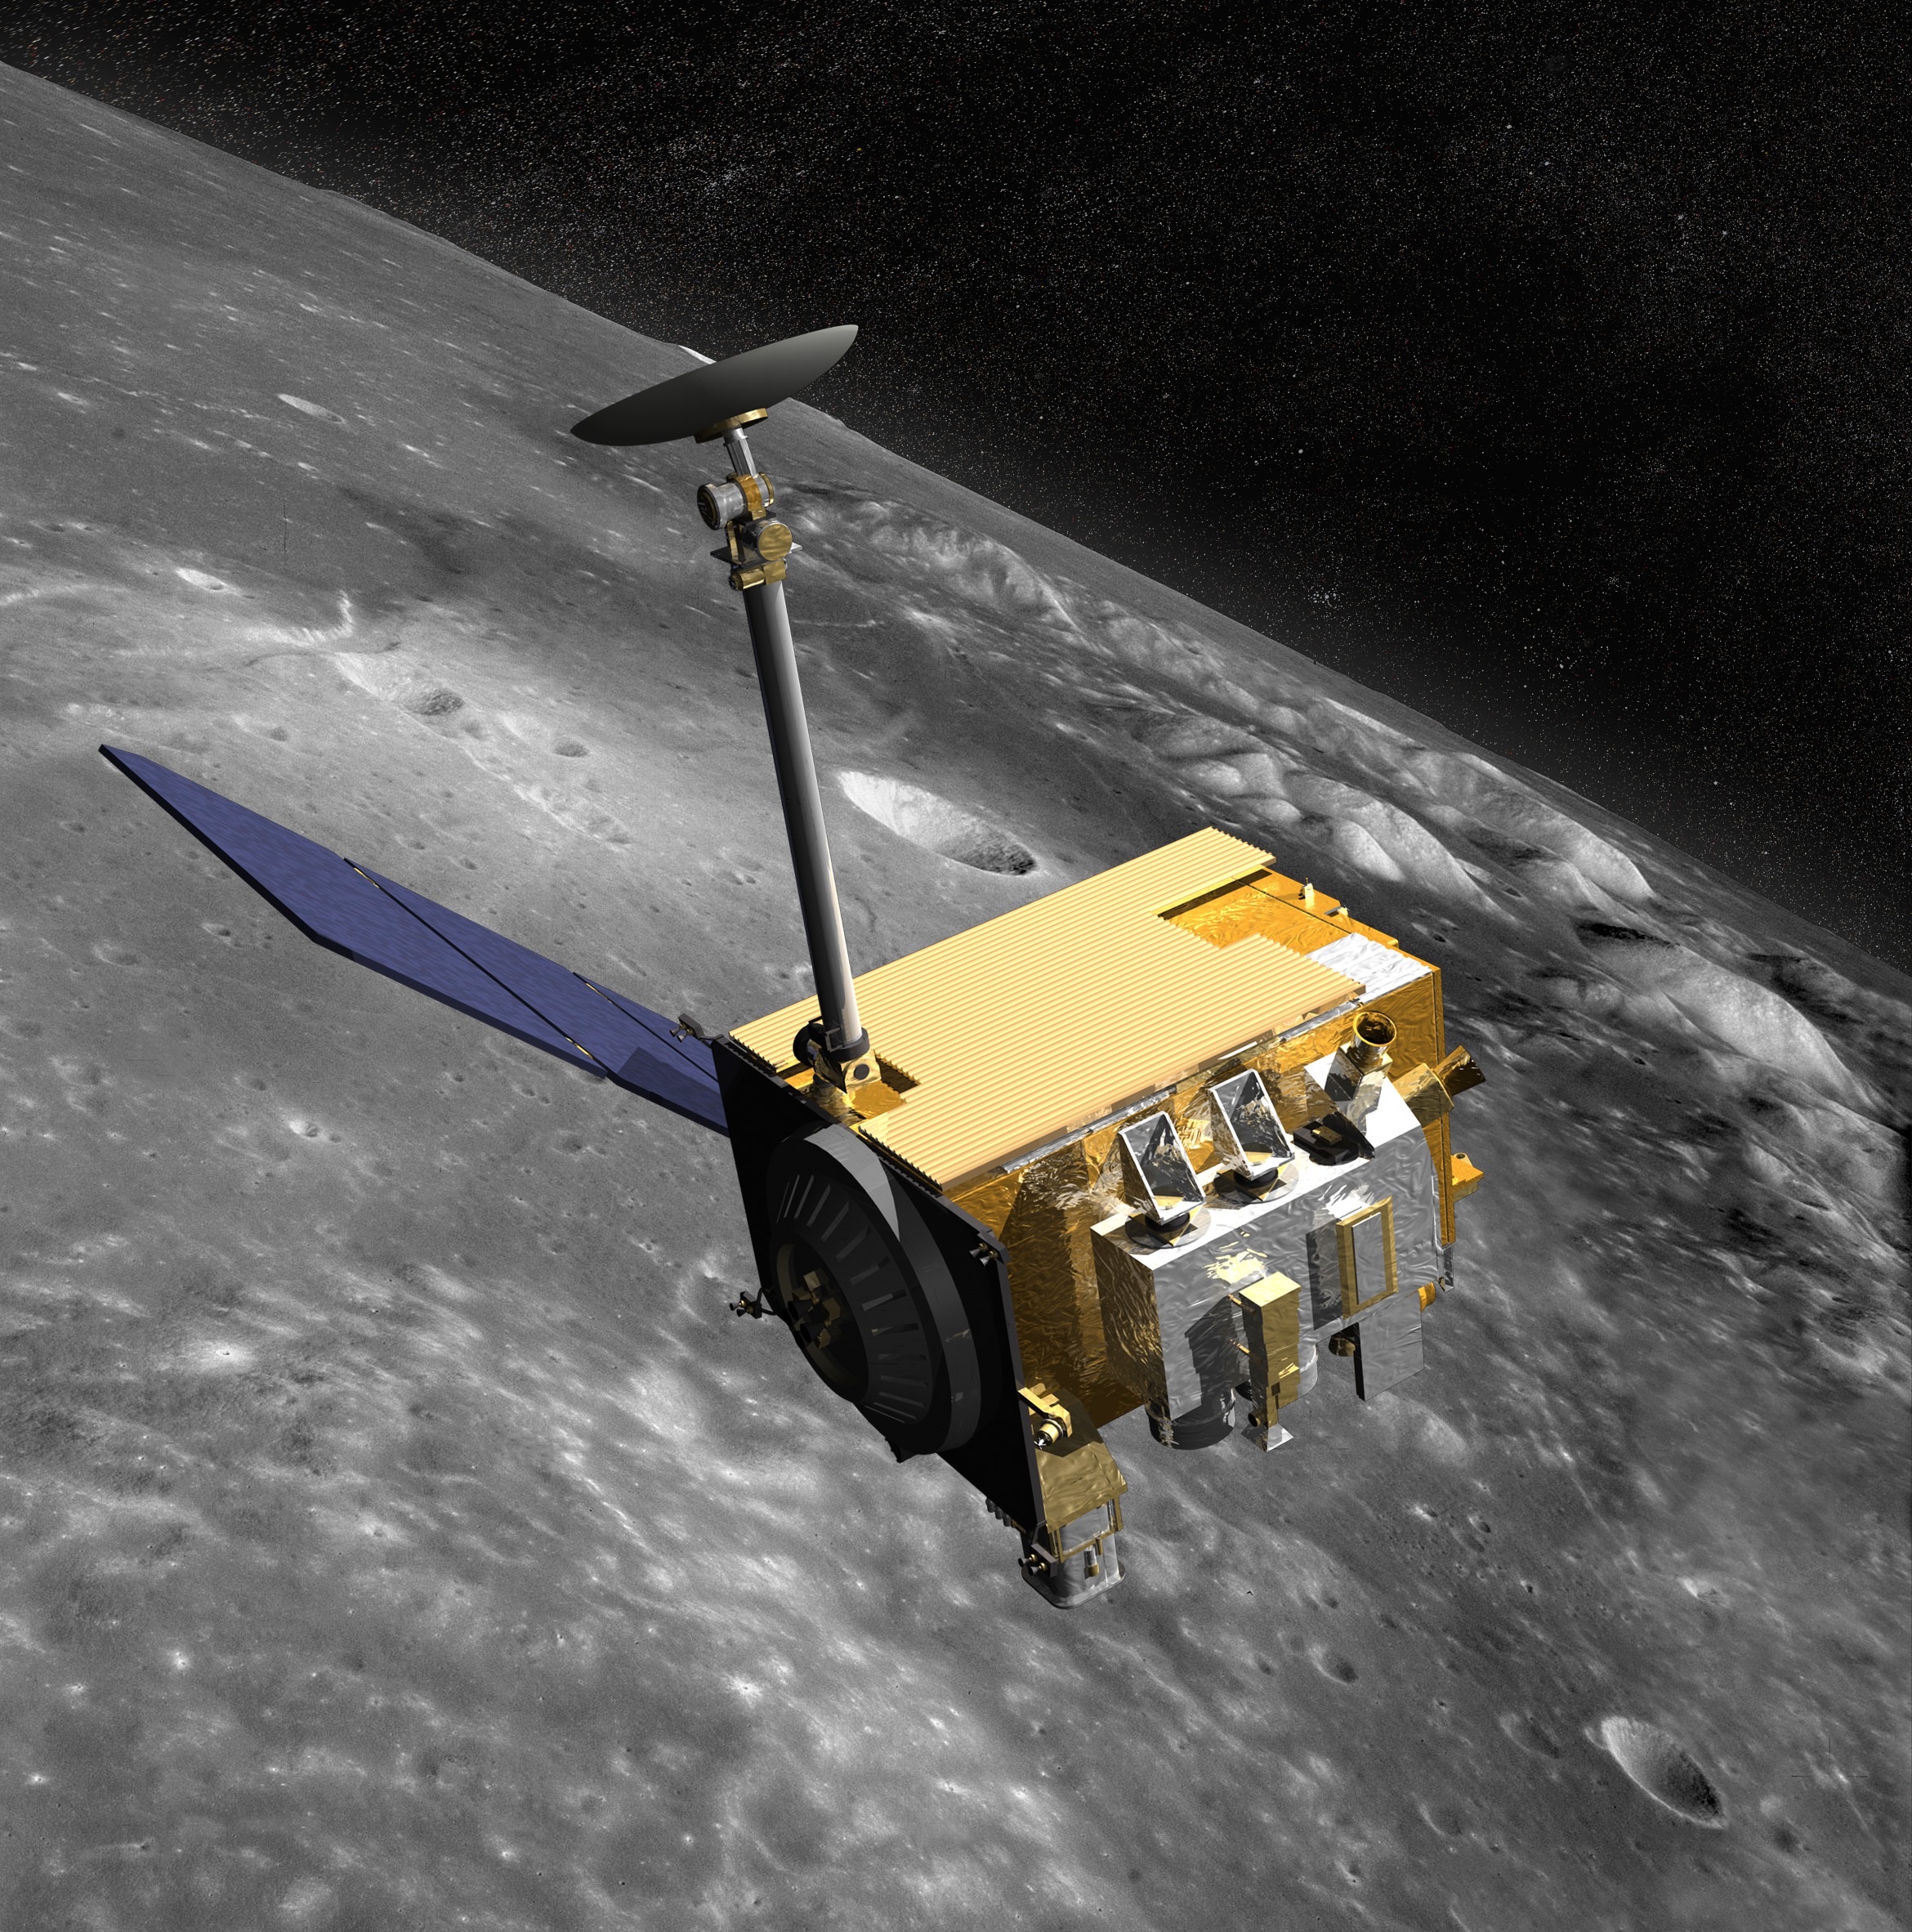
This artistic rendering shows NASA’s Lunar Reconnaissance Orbiter (LRO) and its array of instruments, which include the Lunar Orbiter Laser Altimeter (LOLA). Image by Chris Meaney, NASA Goddard Conceptual Image Lab.
The scientists addressed LOLA’s challenges by deploying a customized software collection (C++, GDAL, GMT, MATLAB, QGIS, and Slurm) on the NCCS ADAPT Science Cloud. “The ability to run multiple memory-intensive jobs simultaneously in a parallel computing environment on ADAPT allowed us to perform this work roughly 100 times faster than would otherwise have been possible on a desktop personal computer,” Barker said.
Among other advances, Barker and collaborators applied a new method for estimating surface height uncertainty. This method uses lunar topography’s fractal nature to build and analyze a statistical ensemble of clones with similar error properties as the data. Running their software routines for 1,000 core-hours produced approximately 200 gigabytes (stored on ADAPT disk) of LOLA-based digital elevation model (LDEM) maps at 5-meter-per-pixel resolution.
Impact: This study develops and applies new techniques for improving the precision of the LOLA polar topographic models and for estimating uncertainties in the new models. Optimizing the models and knowing their uncertainty are important because such models provide the geodetic backbone for science and mission planning studies, including those for NASA’s Artemis Program.
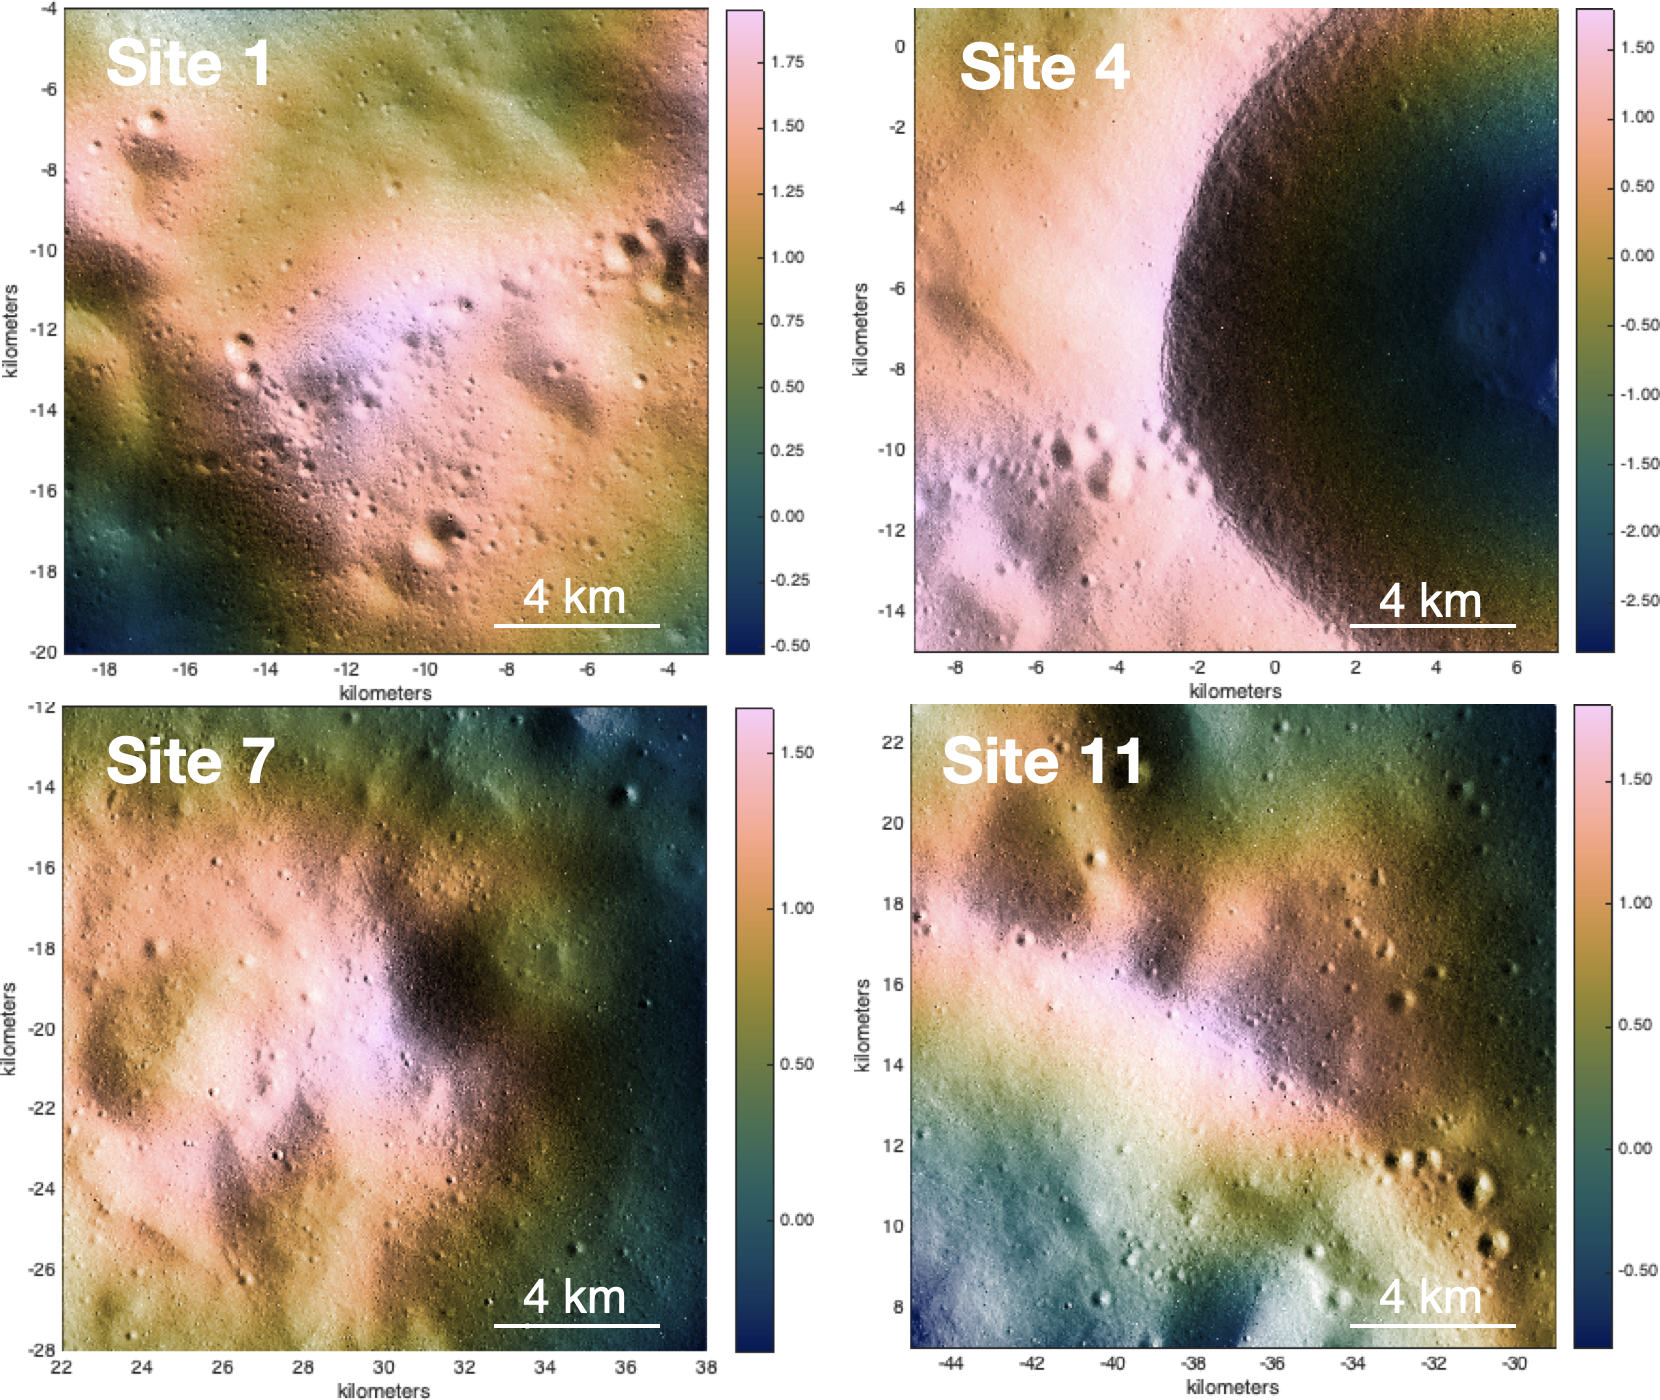
These shaded relief images visualize new Lunar Orbiter Laser Altimeter (LOLA)-based digital elevation model (LDEM) maps of four potential mission landing sites near the Moon’s South Pole. The color scale is in kilometers (km), and the pixel scale is 5 meters per pixel. Figure by Michael Barker, NASA Goddard.
Scientists are also building digital elevation models (DEMs) at the Moon’s South Pole using panchromatic optical data from LRO’s Narrow Angle Camera (NAC). NAC and LOLA have “complementary strengths and weaknesses,” Barker noted. “NAC DEMs have higher resolution and denser spatial coverage (outside shadowed regions), while LOLA DEMs have better geolocation accuracy and are not hindered by shadows. We need both high resolution (~1 meter) and dense spatial coverage to fully characterize a site’s topography, including hazards like boulders and craters.”
Related Links
- Barker, M.K., E. Mazarico, G.A. Neumann, D.E. Smith, M.T. Zuber, and J.W. Head, 2021: Improved LOLA Elevation Maps for South Pole Landing Sites: Error Estimates and Their Impact on Illumination Conditions. Planetary and Space Science, 203, 105119, doi:10.1016/j.pss.2020.105119.
- NASA’s Scientific Visualization Studio: Shadows near the Moon's South Pole, Apr. 1, 2021.
- NASA’s Scientific Visualization Studio: Visualizing Shackleton Crater, Jun. 21, 2012.
Jarrett Cohen, NASA Goddard Space Flight Center