NCCS SPATIAL ANALYTICS PLATFORM
HELPS THE GFED PROJECT SPEED UP
GLOBAL AND LOCAL FIRE ANALYSIS

GFED Project Overview
One of the many resources offered by the NASA Center for Climate Simulation (NCCS) is the NCCS Spatial Analytics Platform, which provides scientists with a centralized and highly available geospatial environment. The platform’s key features include close integration with NCCS’s high-performance computing capabilities, accelerated collaborative analytics, advanced visualization, custom applications, and the ability to quickly process vast amounts of data.
NASA scientists Douglas Morton and Anika Halota are using the NCCS Spatial Analytics Platform and its Esri ArcGIS Server resources to provide a new, publicly shared data visualization analysis resource, the Global Fire Emissions Database (GFED). The GFED Analysis tool combines satellite information on fire activity and vegetation productivity to estimate monthly burned areas and fire emissions.
Supported by the NASA Carbon Monitoring System, the main goal of the GFED project is to quantify global fire emissions and provide near real-time emission estimates for tracking of ongoing fire events. The GFED Analysis tool leverages NCCS Geographic Information System (GIS) capabilities to share maps of daily fire emissions and enable users to summarize these data over customized regions of interest using the ArcGIS Summary Statistics tool.
The GFED Analysis tool combines satellite information on fire activity and vegetation productivity to estimate gridded monthly burned areas and fire emissions as well as scalars that can be used to calculate emissions at higher temporal resolutions. The GFED tool also uses the NCCS ArcGIS Server to host the 2003-2016 Global Fire Atlas dataset and map, allowing users to browse historical fire events. Data from the GFED team on the NCCS GIS servers can also be shared with other scientific users, including scientists in the NASA Earth Science Disasters Program.
GFED Data Sources
The GFED’s fire datasets come from a variety of instruments and satellites, including the Moderate Resolution Imaging Spectroradiometer (MODIS) instruments aboard the sun-synchronous Terra and Aqua satellites. MODIS datasets are summarized into quarter-degree, daily fire count maps provided by the analysis tool on the NCCS GIS server. Complementing MODIS data are two other GFED data sources: the Visible Infrared Imaging Radiometer Suite (VIIRS) sensors aboard the sun-synchronous NASA/NOAA Suomi NPP satellite and the polar-orbiting, non-geosynchronous NOAA-20 satellite.
The VIIRS sensors on both SUOMI NPP and NOAA-20 have a 375-meter spatial resolution, providing greater ability to detect small active fires, improved mapping of large fire perimeters, and better fire detection at night. Consequently, these data are well suited for supporting fire management (e.g., alert systems) and other science applications requiring improved fire mapping fidelity. GFED uses VIIRS fire detection data as input to calculate emissions estimates for existing fires and for the historical fire atlas; the data will also be used for the upcoming ArcGIS Server Operations Dashboard. These detections will be downloaded daily and used to track fire events in the Amazon.

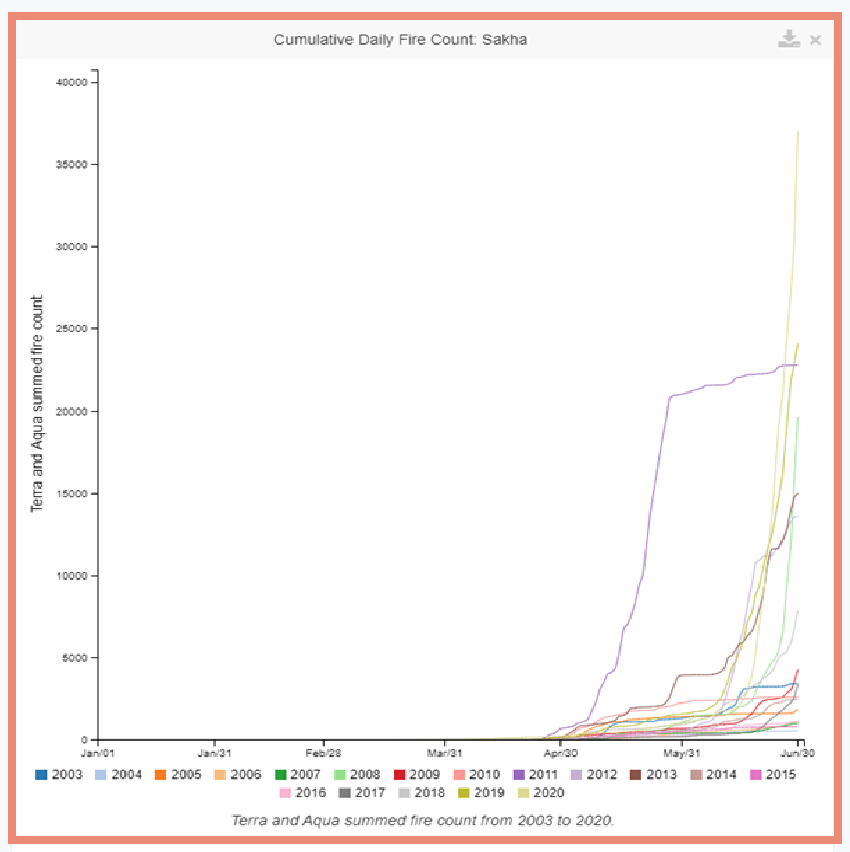
Animated GIF of the daily carbon emissions from fires in the Sakha province during the June 2020 heat wave in Siberia, shown above at a temporal frequency of 5 days. The GFED tool was used to quickly compare the daily active fire counts (from MODIS data) back to 2003. Using the daily emissions estimates map, GFED scientists were able to visualize June 2020 carbon emissions, as shown in the graph below. Source: Anika Halota, GFED.
Accelerating Fire Analysis
The GFED tool removes barriers of entry for non-technical users by providing an intuitive graphical user interface. Researchers can quickly and easily investigate fires in specific regions without having to download data, write computer code, or work with complex HDF5 data library files. GFED users can simply select a particular area of interest, a timescale, and a data type to generate a customized set of graphs and daily emissions estimate maps.
By utilizing the popular ArcGIS Server Representational State Transfer (REST) web service format, the GFED tool provides a long-term record of fire data that can easily be searched and filtered to a user’s region of interest.
“The GFED Analysis tool was initially built using the (now discontinued) H5 Server REST format, which was more difficult to maintain and less transferable,” explained project scientist Anika Halota. “By using web services provided by the NCCS Esri ArcGIS Server REST, we are able to quickly add new features and provide users with a data visualization system that does not require as much customized code or maintenance.”
The Future
In 2020, the GFED team will publish an ArcGIS Server Operations Dashboard focused on near real-time processing of fire events in the Amazon, highlighting key metrics of ongoing fire events in this region.
Impact
“GFED harnesses the power of NASA’s long-term satellite data records on fire activity and new near-real time capabilities to study the changing role of fire in the Earth system,” observed Douglas Morton, Chief of the Biospheric Sciences Laboratory at NASA Goddard. “Working with NCCS has accelerated our ability to generate real-time data products on fire activity and fire emissions for situational awareness during fire emergencies.”
Related Links
- Global Fire Emissions Database: https://www.globalfiredata.org
- NASA Disasters Mapping Portal: https://maps.disasters.nasa.gov
- NCCS Spatial Analytics Platform: https://maps.nccs.nasa.gov
Sean Keefe, NASA Goddard Space Flight Center