Every Day is Earth Day
at the NASA Center for Climate Simulation

Above: The Discover supercomputer, located at the NASA Center for Climate Simulation (NCCS) at NASA Goddard Space Flight Center in Greenbelt, Maryland. Below: Animation of the global transport of smoke during the 2019 to 2020 Australian bushfire season using global observations of aerosol optical depth from NASA instruments aboard the Terra/Aqua satellites. The GEOS-FP aerosol distributions reveal several high-impact events across the globe between August 2019 and January 2020. Weather events including Hurricane Dorian in August to September 2019 and many other tropical cyclones around the world are captured in this visualization, along with major fire events in South America and Indonesia in August to September 2019 and extreme wildfires in Australia from December 2019 to January 2020. Image credit: William Putnam/GMAO/NASA.
Earth Day, celebrated each year on April 22, was first established in the United States in 1970. The goal of its founders was to increase public awareness of the impact of pollution on human health and foster a sense of stewardship in a new generation of Americans about the Earth ecosystem that humans share with plants, animals, and insects. In the five decades since its founding, Earth Day has become a global event with thousands of supporting organizations actively engaging a billion or more Earthlings across hundreds of countries.
As NASA celebrates the 52nd annual Earth Day, we reflect on NASA’s long history of studying our home planet using data and images collected by instruments and astronauts aboard NASA spacecraft – a practice that began with the agency’s launch of Earth-observing spacecraft in the 1960s. NASA’s decades-long experience in Earth observations and the agency’s policy of open access to its collected datasets for research – combined with NASA’s supercomputing tools and resources to more effectively access and analyze such big data – helps scientists provide a comprehensive, real-time history of the dynamic and complex planet we call Earth.
Analyzing that historic data, in turn, helps researchers build data-rich, sophisticated computer models to more accurately predict future changes in land, sea, and air. Collecting and adding newly collected data also helps scientists fine-tune those models and predictions. This is how NASA has become an essential leader in helping humanity plan for the future in a changing climate.
The theme of Earth Day 2022 is “Investing in Earth.” A significant investment in understanding Earth has already been made with the creation of the NASA Center for Climate Simulation (NCCS) at NASA Goddard Space Flight Center in 1990, where every day is Earth Day.
The mission of the NCCS is “to enhance NASA capabilities in Earth Science, with an emphasis on weather and climate prediction, and to enable future scientific discoveries that will benefit humankind.” At the NCCS, a cadre of computer and data scientists provide an array of high-end computing resources to NASA-affiliated scientists who research Earth (and the larger universe) to fulfill that mission. In addition to powerful supercomputers, NCCS supplies optimized access to NASA’s open data and customized support for project-specific scientific analysis. Scientists access NCCS tools for deep learning, intensive data modeling, large-scale data analytics, and remote visualization.
Researchers use state-of-the-art NCCS computers and tools to study and better understand Earth’s physical systems: its mantle, cryosphere, oceans, land, atmosphere, climate system, and magnetosphere. They also study dynamic, short-term events such as weather, wildfires, hurricanes, volcanic eruptions, floods, droughts, and landslides.
Combining rich datasets from satellites, airborne instruments, and field data with the processing power of the NCCS Discover supercomputer and the Explore/ADAPT Science Cloud, scientists use multi-decade, high-resolution climate data to create and refine highly accurate climate models used to inform shorter-term forecasts.
The 97,000-core Discover supercomputing cluster is particularly suited for large, complex, communications-intensive problems employing large matrices and science applications. Example applications include fine-scale, high-fidelity simulations of Earth’s atmosphere and oceans that span timescales from days (for weather prediction), to seasons and years (for short-term climate prediction), to decades and centuries (for longer-term climate change projection).
By studying such phenomena as the development of precipitation within clouds and derecho wind patterns, NCCS resources help scientists create and refine ever-more accurate simulation models for understanding and predicting large storm systems. Extreme weather events such as the widespread, two-day tornado outbreak spanning from Texas to Maryland in April 2020 and the catastrophic 100-year rainstorm that flash-flooded much of Europe in July 2021 are becoming increasingly important to forecast – and prepare for – at local, regional, and global scales.
This animation shows rainfall estimates for the Southeast region of the United States from Sunday, April 12, 2020 into Monday, April 13, when a series of powerful thunderstorms across the southern U.S. brought heavy rainfall and spawned several destructive tornadoes. The data shown was derived from NOAA tornado reports (red triangles) and NASA's Integrated Multi-satellite Retrievals for GPM (IMERG) algorithm, which combines information from the GPM satellite constellation to estimate precipitation over the majority of the Earth's surface. Animation credit: Credit: Jason West, NASA Goddard.
Investing in NASA’s high-end computing resources and making them available for comprehensive research projects at and beyond NASA is a significant investment in our planet, reflecting the theme of Earth Day 2022. By understanding our planet, Earthlings can understand and prepare for changing weather conditions, changing climate, and natural disasters, which can ultimately help save lives.
In addition, by understanding how human activities such as land development, industrialization, biomass burning, and fossil fuel burning impact our planet, people can also better understand how their activities may affect Earth’s entire ecosystem – including humans, plants, and animals. Investing in NCCS supercomputers and NASA’s accurate Earth system models can also inform better stewardship of the Earth system in ways that protect the quality and longevity of life.
Here are just a few recent examples of NCCS-supported scientific research of Earth:
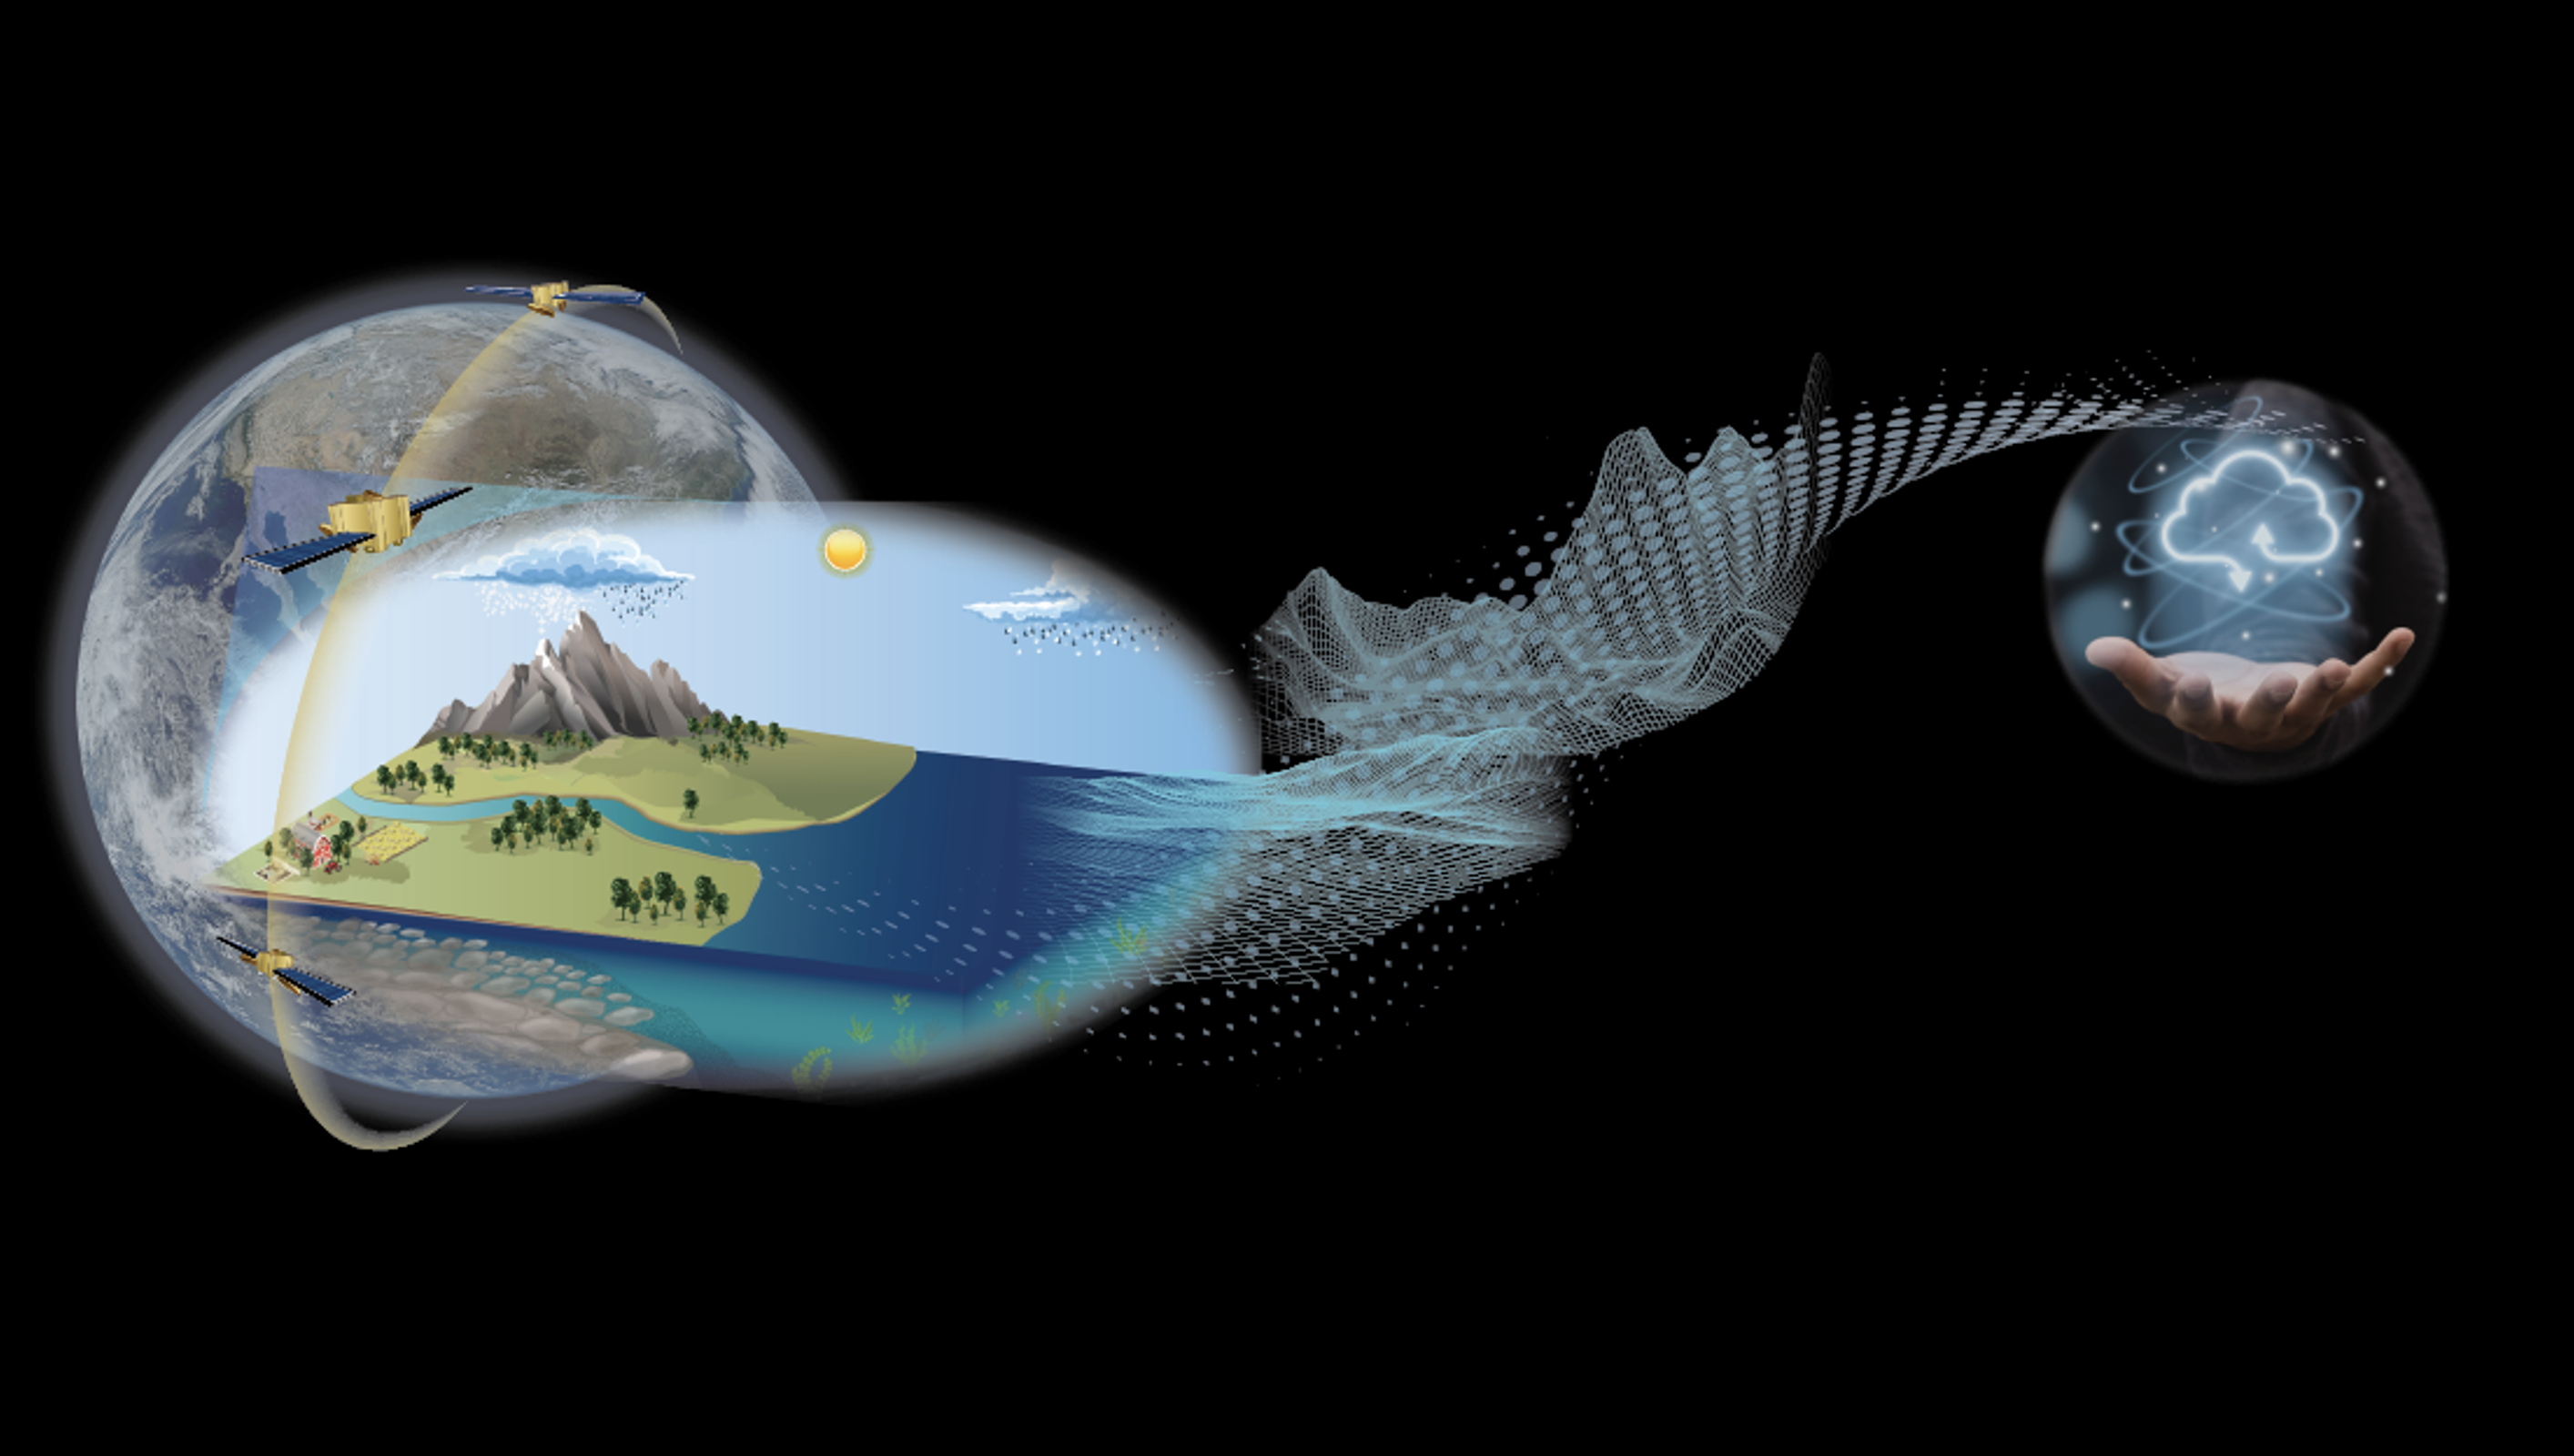
The Earth Information System Pilot Study
NASA recently delivered an online pilot project called the Earth Information System (EIS), featuring three critical Earth science study areas: freshwater, sea level change, and fire. The EIS pilot project was developed with the support of the Science Managed Cloud Environment (SMCE) program at the Computational and Information Sciences and Technology Office (CISTO) within NASA’s Sciences and Exploration Directorate (SED). The SMCE team optimizes the scientific return of NASA data by focusing on researchers’ project-specific needs and rapidly developing customized and flexible Cloud computing environments. SMCE supports open data, open source software, and open science principles that can be used to accelerate scientific discovery and increase participation in the scientific process. Embedded within the SED at NASA Goddard, the SMCE team co-designs cloud-based solutions with its customers to accelerate science research in the Cloud. Links to the three EIS pilot projects are below.
- EIS Freshwater
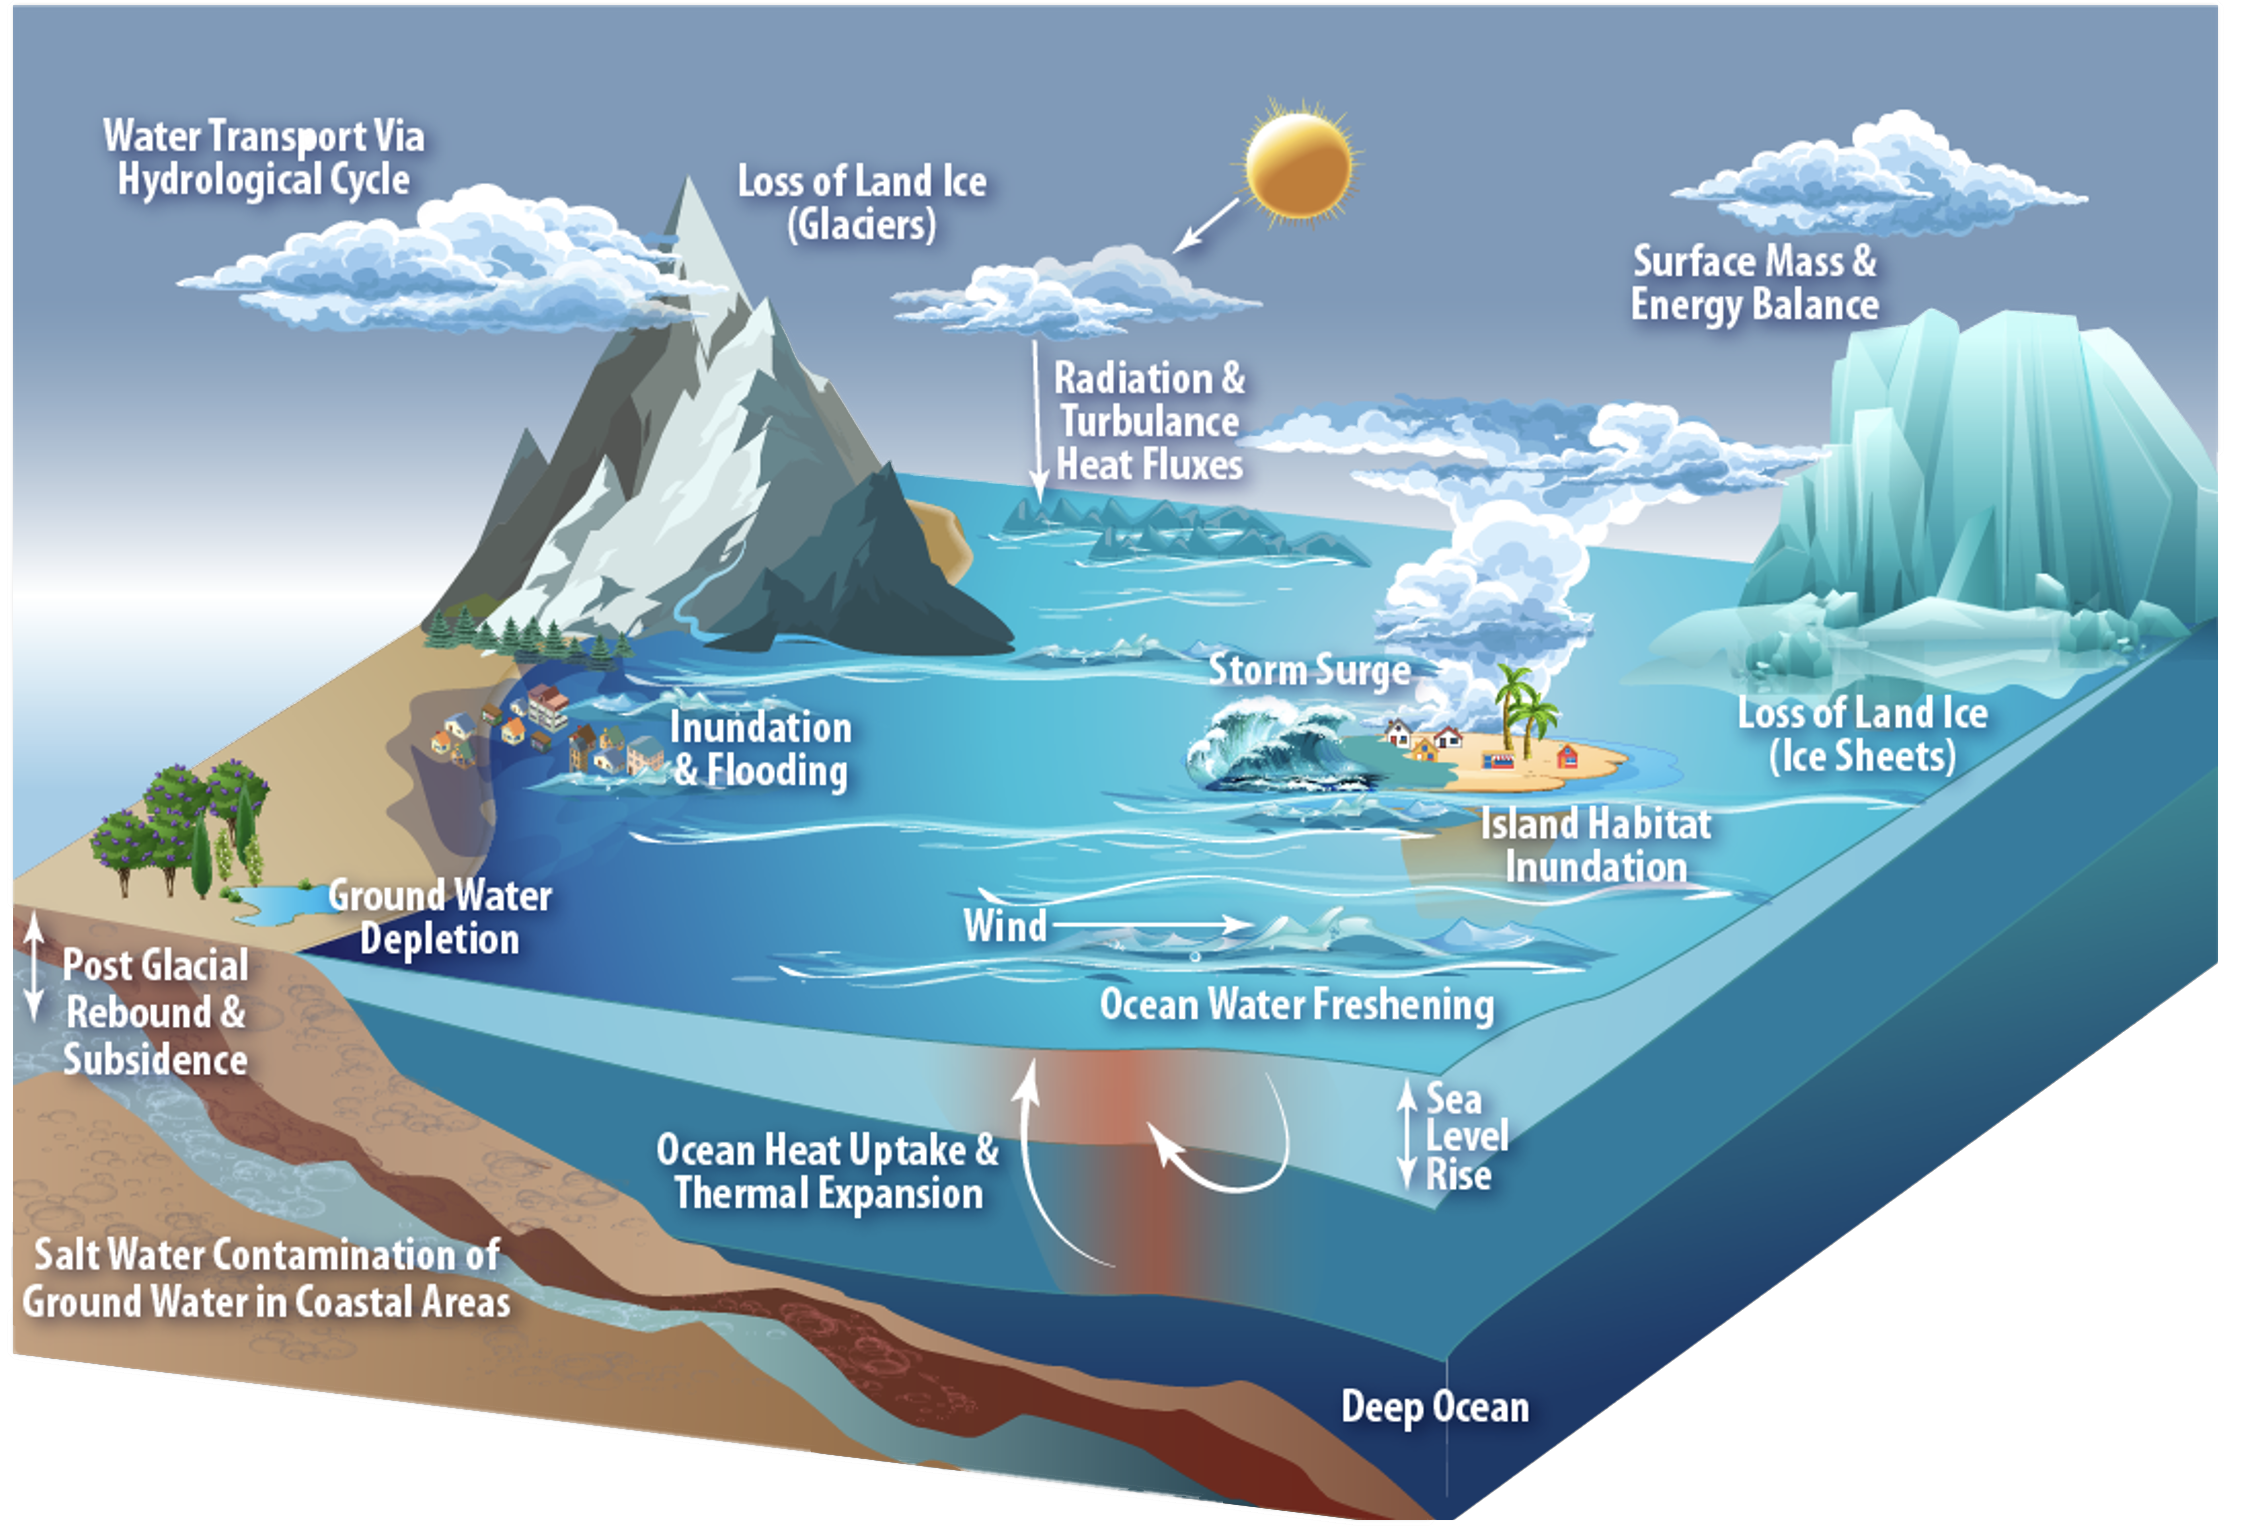
- EIS Sea Level Change
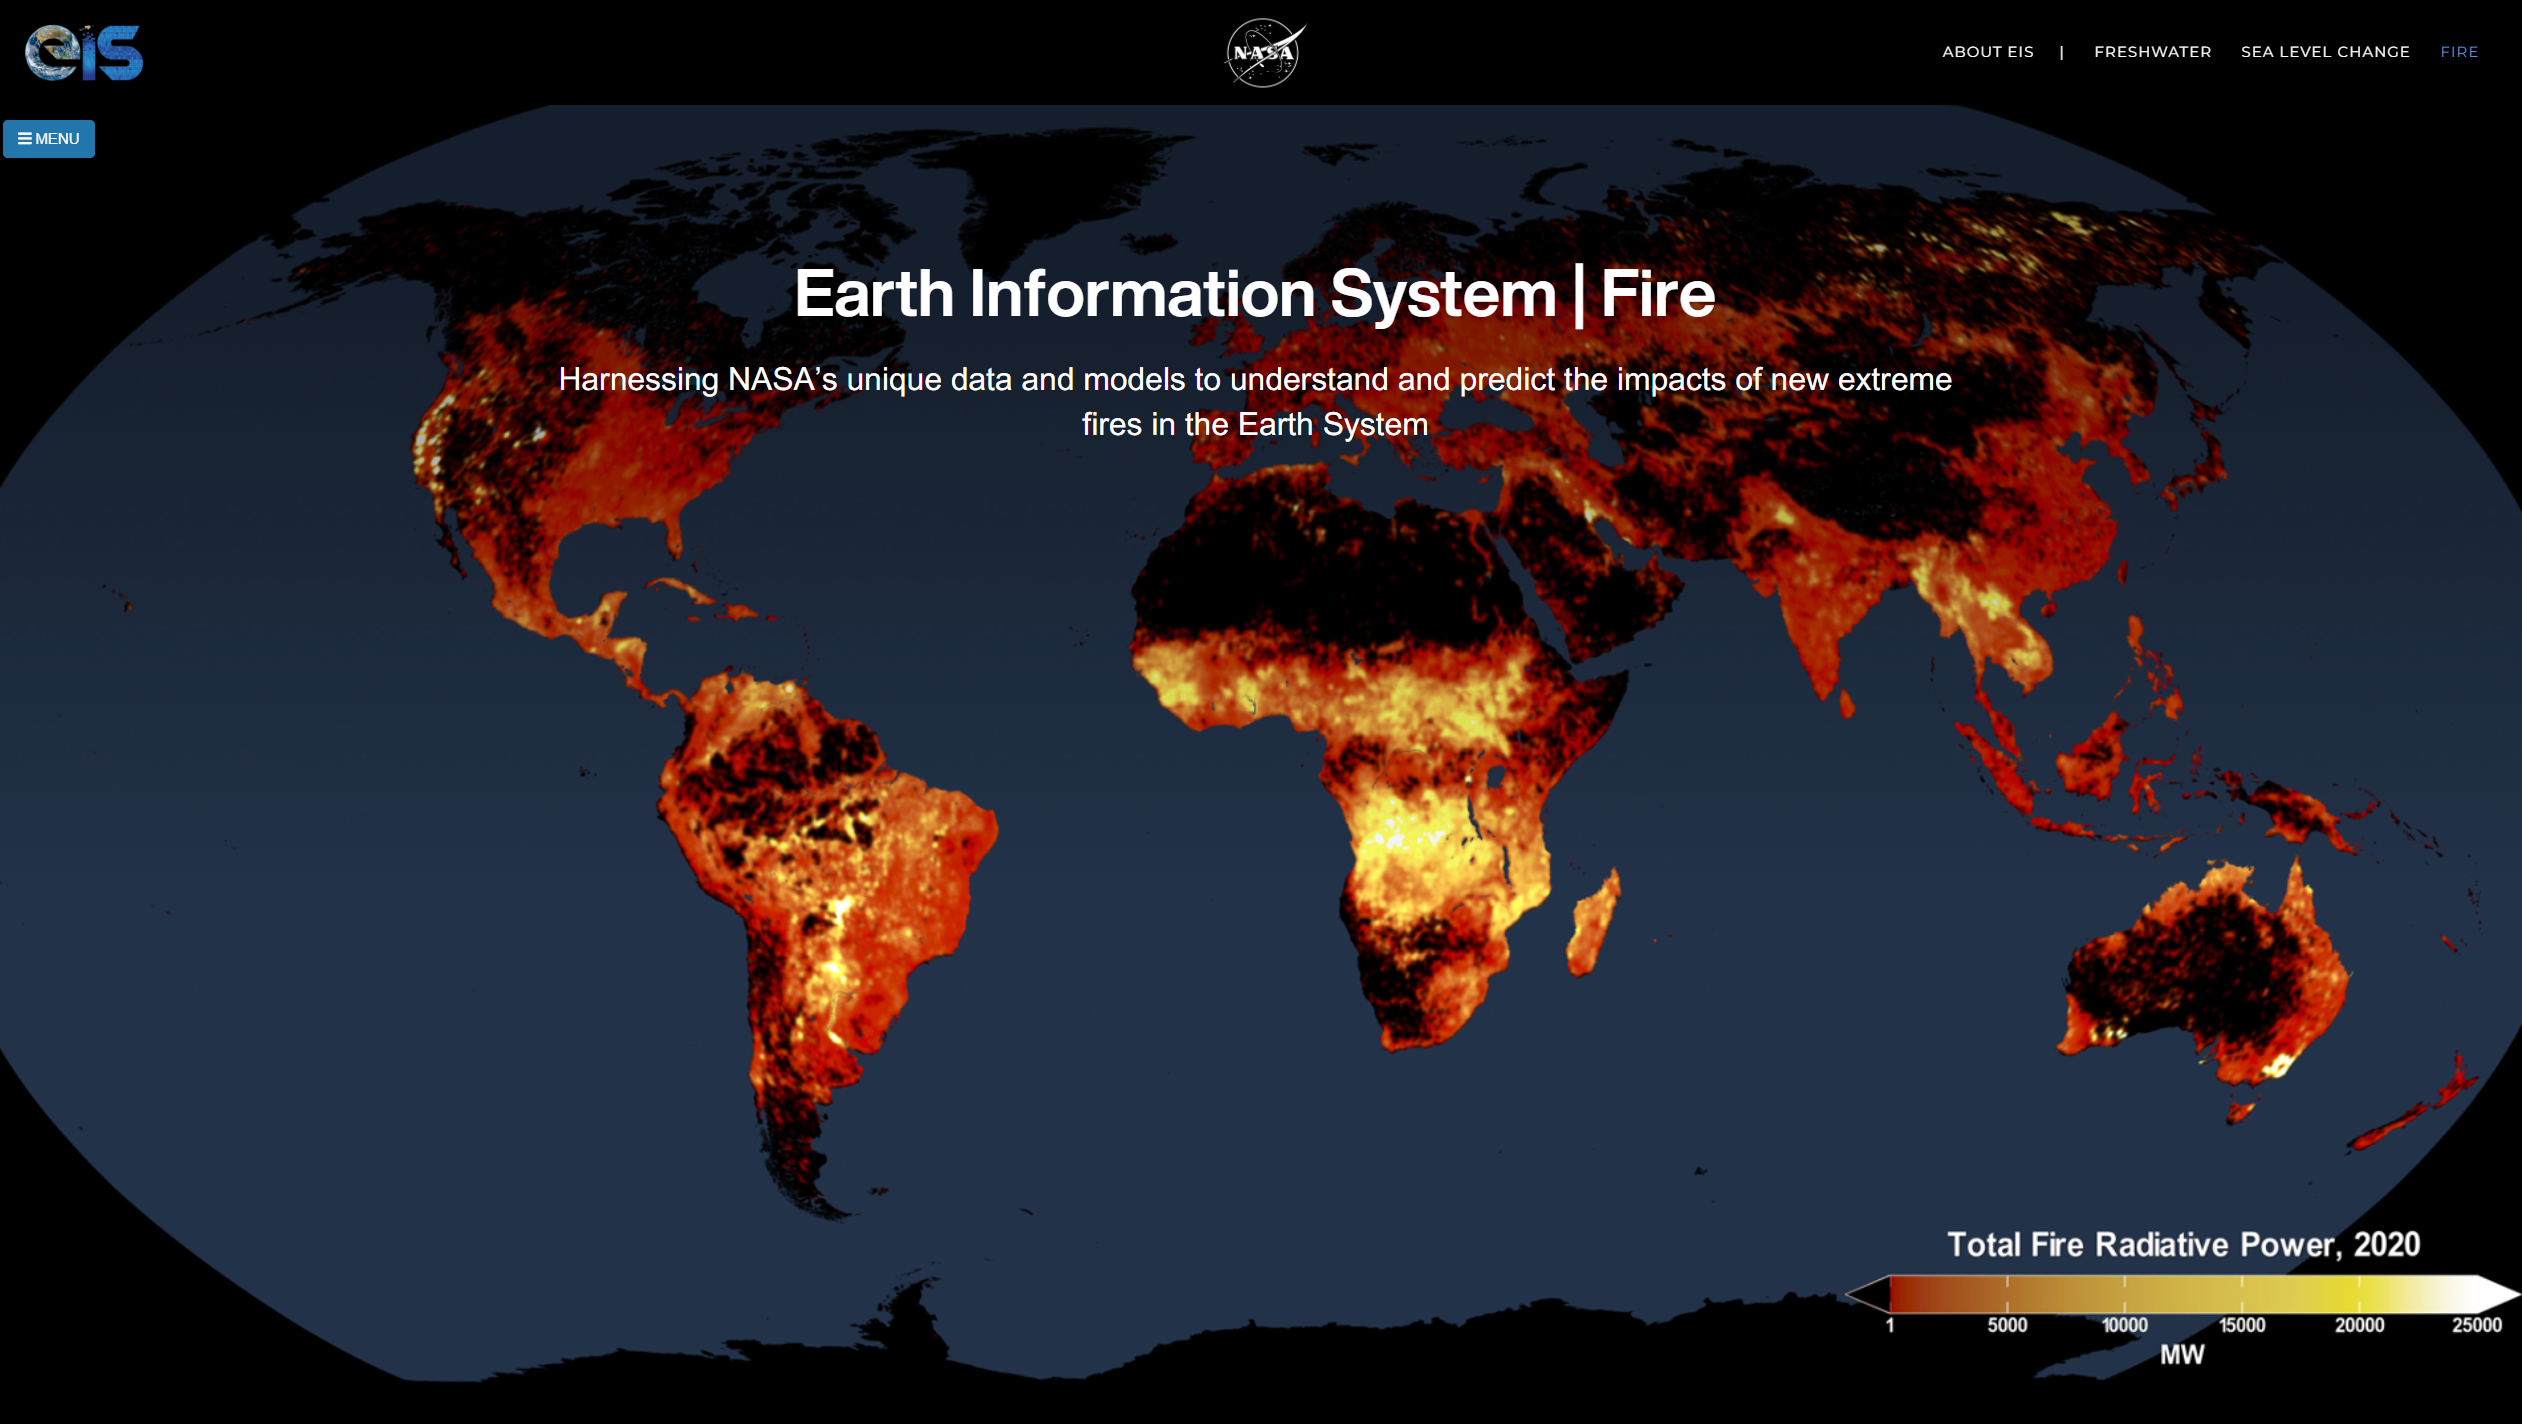
- EIS Fire
Beyond the EIS Pilot Project, other recent NASA Earth science-related research projects conducted with NCCS high-end computing resources and support include:
Understanding Australia Bushfires
To better understand how Australia’s unprecedented wildfires that raged from September 2019 to March 2020 affected vegetation, NASA Goddard scientists from the Hydrological Sciences Laboratory and international collaborators mounted an experiment at the NCCS, assimilating NASA satellite data into a computer model and analyzing the output.
As of April 2022, estimates indicate that over 17 million hectares (65,000 square miles) of land were burned during the 2019-2020 bushfire season – including a major portion of several national parks and reserves and a major portion of two World Heritage areas: the Greater Blue Mountains Area and the Gondwana Rainforests. The impact of these extreme bushfires to wildlife and ecosystems is practically incalculable. Studies such as the one conducted by NASA Goddard Space Flight Center scientists and international collaborators using the Discover supercomputer, the expertise of the SMCE team, and the resources of the EIS pilot study will continue to be invaluable as Earth’s wildfires continue to grow more extreme.

Left: The Orroral Valley Fire rages on January 28, 2020 near Tuggeranong, the southernmost town of Australia’s capital city, Canberra. This bushfire consumed over 155,000 acres in a week. Photo by Nick-D acquired from Wikimedia Commons. Right: A thousand-year-old white beech tree, approximately 50 meters (164 feet) tall, in Tooloom National Park, part of the Gondwana Rainforests of Australia. Photo by Peter Woodard via Wikimedia Commons.
Modeling The Melting of Snowflakes in Storm Systems
To accurately capture the dynamics of storm systems and simulate microwave signatures for remote sensing applications such as radar observations, scientists from CISTO, the University of Maryland Baltimore County’s (UMBC) Joint Center for Earth Systems Technology (JSET), and the University of Maryland’s Earth System Science Interdisciplinary Center (ESSIC) are using NCCS computing power to produce more realistic, mixed-phase hydrometeors (water or ice particles that have formed in the atmosphere as a result of condensation or sublimation) used for radiative modeling of the melting layer – the altitudes throughout which ice-phase precipitation melts as it descends. This research will help scientists better model and understand the radar signatures of the growth of precipitation in ice clouds.

At the top of stratiform rainstorms, clumps of snowflakes melt into raindrops as they fall towards the surface of the Earth and temperatures rise above freezing. To study rainstorms and provide more accurate weather predictions, NASA scientists use computers to create synthetic snowflakes and simulate the process of melting into raindrops. Animation by Craig Pelissier/NASA.
Communicating Air Pollution Health Risk
Air pollution is one of the leading causes of death around the globe. To help people understand their air pollution risk in areas of the world without pollution warning resources, a team of collaborators at New York University, Morgan State University, and NASA Goddard’s Global Modeling and Assimilation Office (GMAO) and Atmospheric Chemistry and Dynamics Laboratory (ACD) are using the power of global air quality models and NCCS supercomputing resources to create a novel air quality index that can be used to communicate children’s respiratory health risk on a given day.

Top row: At left, wet monsoon clouds loom over Shish Gumbad, a 15th Century monument at Lodhi Gardens in New Delhi, India. Photograph by Abhishek.rai777, CC BY-SA 4.0, via Wikimedia Commons. Center: Delhi children walking under a “sunbrella.” Image credit: Max Pixel. At right: A crowded city street in New Delhi. Photograph by Igor Ovsyannykov, CC0 1.0, via Creative Commons. Bottom row: Two views of the plains of the Indian subcontinent and the Tibetan Plateau taken from the MODIS instrument aboard NASA’s Aqua satellite on November 7, 2017 reveal the air quality over Pakistan and India during the dry monsoon. At left, a natural-color image shows haze and fog blanketing the region on that date. At right, a data map based on MODIS sensor data shows the aerosol optical depth, a measure of how airborne particles affect the reflection and absorption of light by the atmosphere. Red-brown colors indicate skies thick with aerosol pollution. Several major cities in Pakistan and India – including Lahore, New Delhi, Lucknow, and Kanpur – faced elevated levels of pollution that day, when the arrival of cooler weather and smoke mixed with fog, dust, and industrial pollution formed a particularly thick haze. The lack of wind, which usually helps disperse air pollution, worsened the problem for several days in November. NASA images.

The city of Lahore, Pakistan in June 2008, with smog almost completely dimming the sun. Photograph by Tore Urnes, CC BY-SA 2.0 via Creative Commons.
Studying Shifting Boreal Forest Patterns
To measure the area of the cold edge of the boreal forest – the ecotone – at locations where previous global estimates often show high discrepancies and to provide a basis for closely examining ongoing changes in the diverse circumpolar biome boundary, two members of the Arctic-Boreal Vulnerability Experiment (ABoVE) Science Team, geographers Paul Montesano of NASA Goddard in Greenbelt, Maryland, and Matt Macander of Alaska Biological Research (ABR) in Fairbanks, Alaska, and their collaborators have taken on this challenge via several recent projects leveraging NCCS resources. Ultimately, the ABoVE team wants to better understand the future of ecosystem functioning in Earth’s high northern latitudes. With the support of the NCCS Explore/ADAPT Science Cloud; Land, Vegetation, and Ice Sensor (LVIS) data; field sensors; and satellites, the team has developed a method of using Landsat tree cover data in a geospatial analysis system to classify forest patterns in and near the northern limit of the boreal forest, doing so in a way that can help identify and map the extent of the biome boundary within the study area shown in the map below.

Above: The forest structure pattern map developed in this research depicts the North American taiga-tundra ecological transition zone across portions of Alaska and Northern Canada. Credit: Paul Montesano, NASA Goddard.
The Impact of Atmospheric Rivers
To better understand atmospheric rivers, which transport water vapor from the tropics towards the poles, GMAO scientists are studying the contribution of such rivers to extreme precipitation events such as the November 2021 flooding along the Pacific Northwest coast.

Total rainfall estimates are shown throughout the Pacific Northwest on November 14, 2021 using the Integrated Multi-satellitE Retrievals for GPM (IMERG) algorithm for the Global Precipitation Measurement (GPM) satellite mission. Image credit: NASA Earth Observatory.
This visualization shows the lifecycle of a December 2010 atmospheric river from formation near Hawaii through depletion of moisture over the mountainous terrain in the U.S. Pacific Northwest, as analyzed by MERRA-2. Research by Allison Collow et al., NASA Goddard GMAO/UMBC. Visualization by Greg Shirah et al., NASA’s Scientific Visualization Studio (SVS).
Sean Keefe, NASA Goddard Space Flight Center
April 22, 2022