More than 5 million observations accumulate every 6 hours to drive weather forecasts run by NASA's Global Modeling and Assimilation Office at the NASA Center for Climate Simulation (NCCS).
July 28, 2015
New Animation Shows Millions of Earth Observations for Forecasting
Assimilation Office uses observations from many sources to drive weather
forecasts supporting agency research efforts. Image by Will McCarty, NASA GSFC.
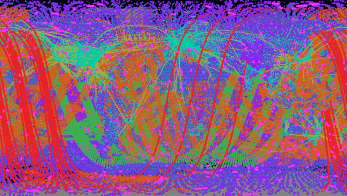
Above Earth’s continents and oceans colored dots burst like fireworks, fly in rectangular formations, and spin fine webs. Eventually a multitude of dots overlay the world as if painting a surreal picture. This animation is not merely artwork—each dot represents an observation from a satellite or other source. More than 5 million observations accumulate every 6 hours to drive weather forecasts by NASA’s Global Modeling and Assimilation Office (GMAO).
These forecasts run at the NASA Center for Climate Simulation (NCCS) using GMAO’s GEOS-5 Data Assimilation System (DAS). “Data assimilation is a process of blending observational and model information to produce the most accurate and physically consistent picture of the atmosphere at a given time,” said Ron Gelaro, GMAO lead scientist for atmospheric data assimilation. GEOS5 DAS couples an atmospheric model to an analysis routine that ingests the observations weighted by their accuracy. The goal is to provide the best possible starting point for the forecasts, which support NASA satellite instrument teams, field campaigns, and weather and climate research.
Observations stream into GEOS-5 DAS from many different sources provided by NASA and national and international partners. “We take all the high-quality data we can get our hands on in a timely enough fashion,” said Will McCarty, the GMAO research meteorologist who created the animation. “For the model you need to know what the world is for every point for every variable.”
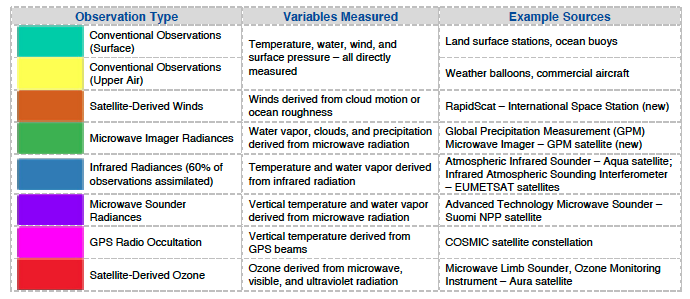
The essential forecast variables are temperature, water, wind, surface pressure, and ozone. Whether measuring these values directly or deriving them in other ways, the assimilated observations come in eight major types (colors are from the animation):
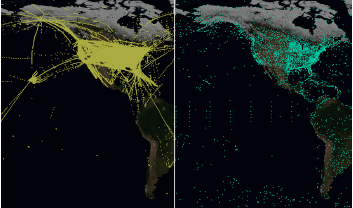
Hemisphere. Note the presence of flight tracks aloft over the United
States and buoy observations in the central and southern Pacific Ocean.
Image by Will McCarty, NASA GSFC.
Even 5 million observations do not cover 100% of the planet, so the model must fill in the gaps. “Blending observations with the model uses the strengths of each and produces something better than either source alone,” Gelaro said.
Running this process continuously requires 700 to 1,000 processor-cores on the NCCS Discover supercomputer. GMAO’s plan to double GEOS-5 model resolution from 25 to 12.5 kilometers by year’s end will demand 10 times the processing power. Gelaro said it is challenging to write model code that can take advantage of so many cores. “We are lucky to have NCCS as a partner,” he said. “Not only do they provide these resources, but we also find out about the strengths and weaknesses of our code and they find out what works well on their supercomputer.” GEOS-5 DAS forecast data (hosted by the NCCS Data Portal and NASA Distributed Active Archive Centers) and animated maps are accessible through the GMAO website. See More Information below.
Jarrett Cohen NASA Goddard Space Flight Center
Contacts | |
|
Will McCarty Research Meteorologist Global Modeling and Assimilation Office NASA Goddard Space Flight Center daniel.q.duffy@nasa.gov 301.286.8830 |
Ron Gelaro Lead Scientist for Atmospheric Data Assimilation Global Modeling and Assimilation Office NASA Goddard Space Flight Center ronald.gelaro-1@nasa.gov 301.614.6179 |
| Dan Duffy High-Performance Computing Lead NASA Center for Climate Simulation NASA Goddard Space Flight Center daniel.q.duffy@nasa.gov 301.286.8830 |
|
More Information | |
| From Observations to Models | Global Modeling and Assimilation Office |