Simulations Probe the Impacts of Air Pollution
on Premature Deaths
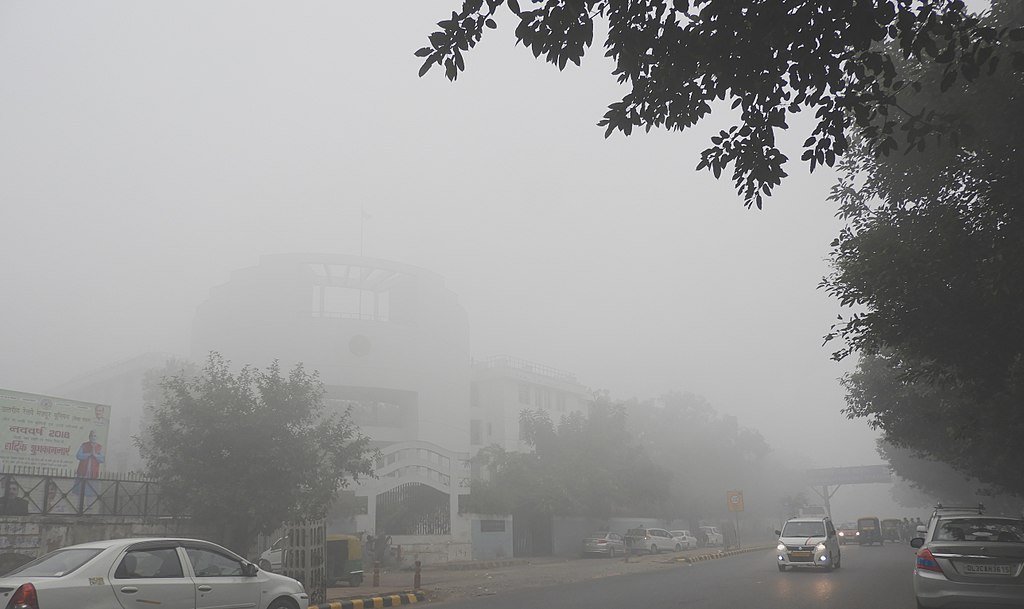
Buildings in New Delhi, India, are barely visible due to thick smog — typically a mixture of surface ozone, particulate matter, and other pollutants. Photo by Sumita Roy Dutta, CC BY-SA 4.0, via Wikimedia Commons.
Models from Aarhus University (AU) in Denmark and the NASA Goddard Institute for Space Studies (GISS) in New York City worked in concert to study the impact of air pollution on premature mortality — both globally and regionally — under several emission and population scenarios.
The World Health Organization has ranked air pollution as the world’s largest single environmental health risk. “Our primary goal was to extend our modeling capabilities to better represent highly polluted regions. such as those in Asia and Africa,” said Ulas Im, Senior Scientist in AU’s Department of Environmental Science. “The study evaluates mortality estimates based on different approaches globally and regionally and attempts to differentiate between the impacts of emissions and population dynamics.”
The AU Senior Scientist collaborated with GISS Research Physical Scientist Susanne Bauer, GISS/Columbia University Research Scientist Konstantinos Tsigaridis, and several other AU and GISS scientists on the computational study, which was recently published in the journal Environmental Research.

The study collaborators are from (left) Aarhus University (AU) in Denmark and (right) the NASA Goddard Institute for Space Studies (GISS) in New York City. AU photo © Villy Fink Isaksen, Wikimedia Commons, License cc-by-sa-3.0. GISS photo by NASA.
The study combined the GISS ModelE climate model, developed on the NASA Center for Climate Simulation (NCCS) Discover supercomputer, with AU’s Economic Valuation of Air Pollution (EVA) model.
“NCCS resources were key for GISS model development, to which some of my co-authors contribute,” Im said. “As external partners we can get the input files and other needed resources from NCCS, such as restart files of equilibrated versions of the model, to save computational time in studies like this one.”
The researchers used the GISS-E2.1-G model to carry out fully coupled atmosphere-ocean climate simulations for the years 2015–2050 using three different emission scenarios from the Coupled Model Intercomparison Project Phase 6 (CMIP6). Next, surface concentrations from GISS-E2.1-G and population data served as inputs to EVAv6.0 for calculating exposure to air pollution and then mortality rates. The simulations ran on high-performance computing servers in AU’s Department of Environmental Science.
Impact: Mitigation of human-made air pollutant emissions can, to a large extent, improve the future mortality burden due to air pollution exposure, but future air quality and public health regulations also should take population dynamics into account.
The simulations focused on estimating:
- Future changes in global and regional mortality from exposure to surface particulate matter (PM2.5) and ozone (O3) pollutants under emission scenarios spanning from high to low mitigation, and
- The role of population and age distribution changes in premature deaths.
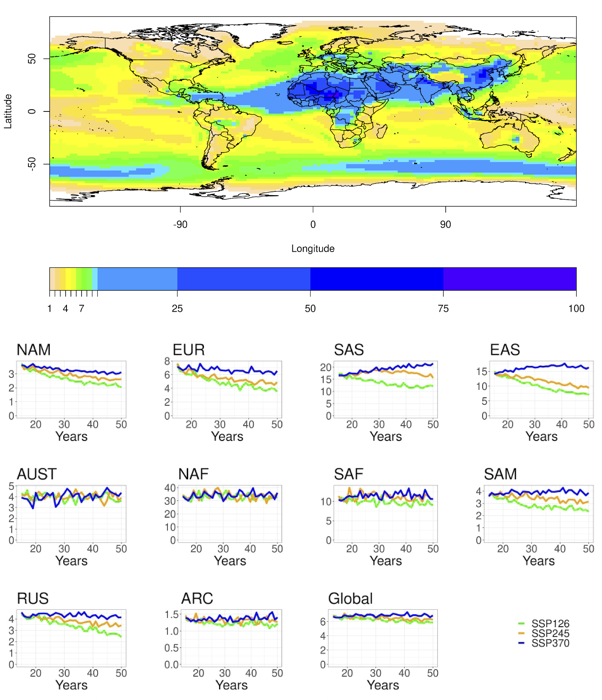
Top: World map showing the global distribution of annual mean surface particulate matter (PM2.5) concentration ratios for the year 2015 in the medium-mitigation emission scenario SSP2-4.5.
Bottom: Graphs showing regional and global changes of PM2.5 surface levels in the future emission projections SSP1-2.6 (high-mitigation), SSP2-4.5, and SSP3-7.0 (low-mitigation). The regions are NAM: North America, EUR: Europe, SAS: Southeast Asia, EAS: East Asia, AUST: Australia, NAF: North Africa, SAF: South Africa, SAM: South America, RUS: Russia, and ARC: Arctic. Figure from Im et al., 2023.
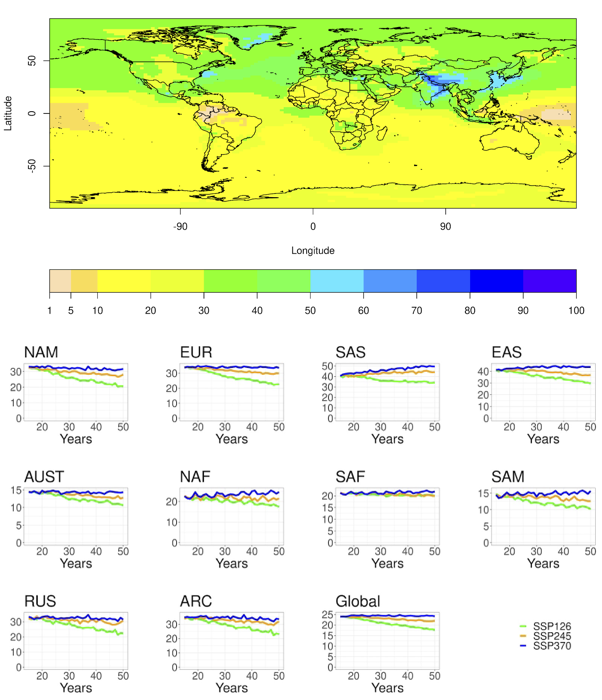
Top: World map showing the global distribution of annual mean ozone (O3) mixing ratios for the year 2015 in the medium-mitigation emission scenario SSP2-4.5.
Bottom: Graphs showing regional and global changes of O3 surface levels in the future emission projections SSP1-2.6, SSP2-4.5, and SSP3-7.0. See the previous figure caption for the emission scenario descriptions and region names. Figure from Im et al., 2023.
“The extended version of the EVA model can use both linear and non-linear risk functions to estimate mortality,” Im said. “The linear model assumes a linear relationship between pollutant mass concentrations and mortality, while the non-linear method uses a fit between the pollutant and mortality based on epidemiological studies, where the relationship may not be linear.”
“Using a linear approach in high-pollution regions such as Asia or Africa can lead to overestimation of calculated mortality,” he added. “We saw agreement between both methods on a global basis, while, on a regional basis, there can be large differences.”
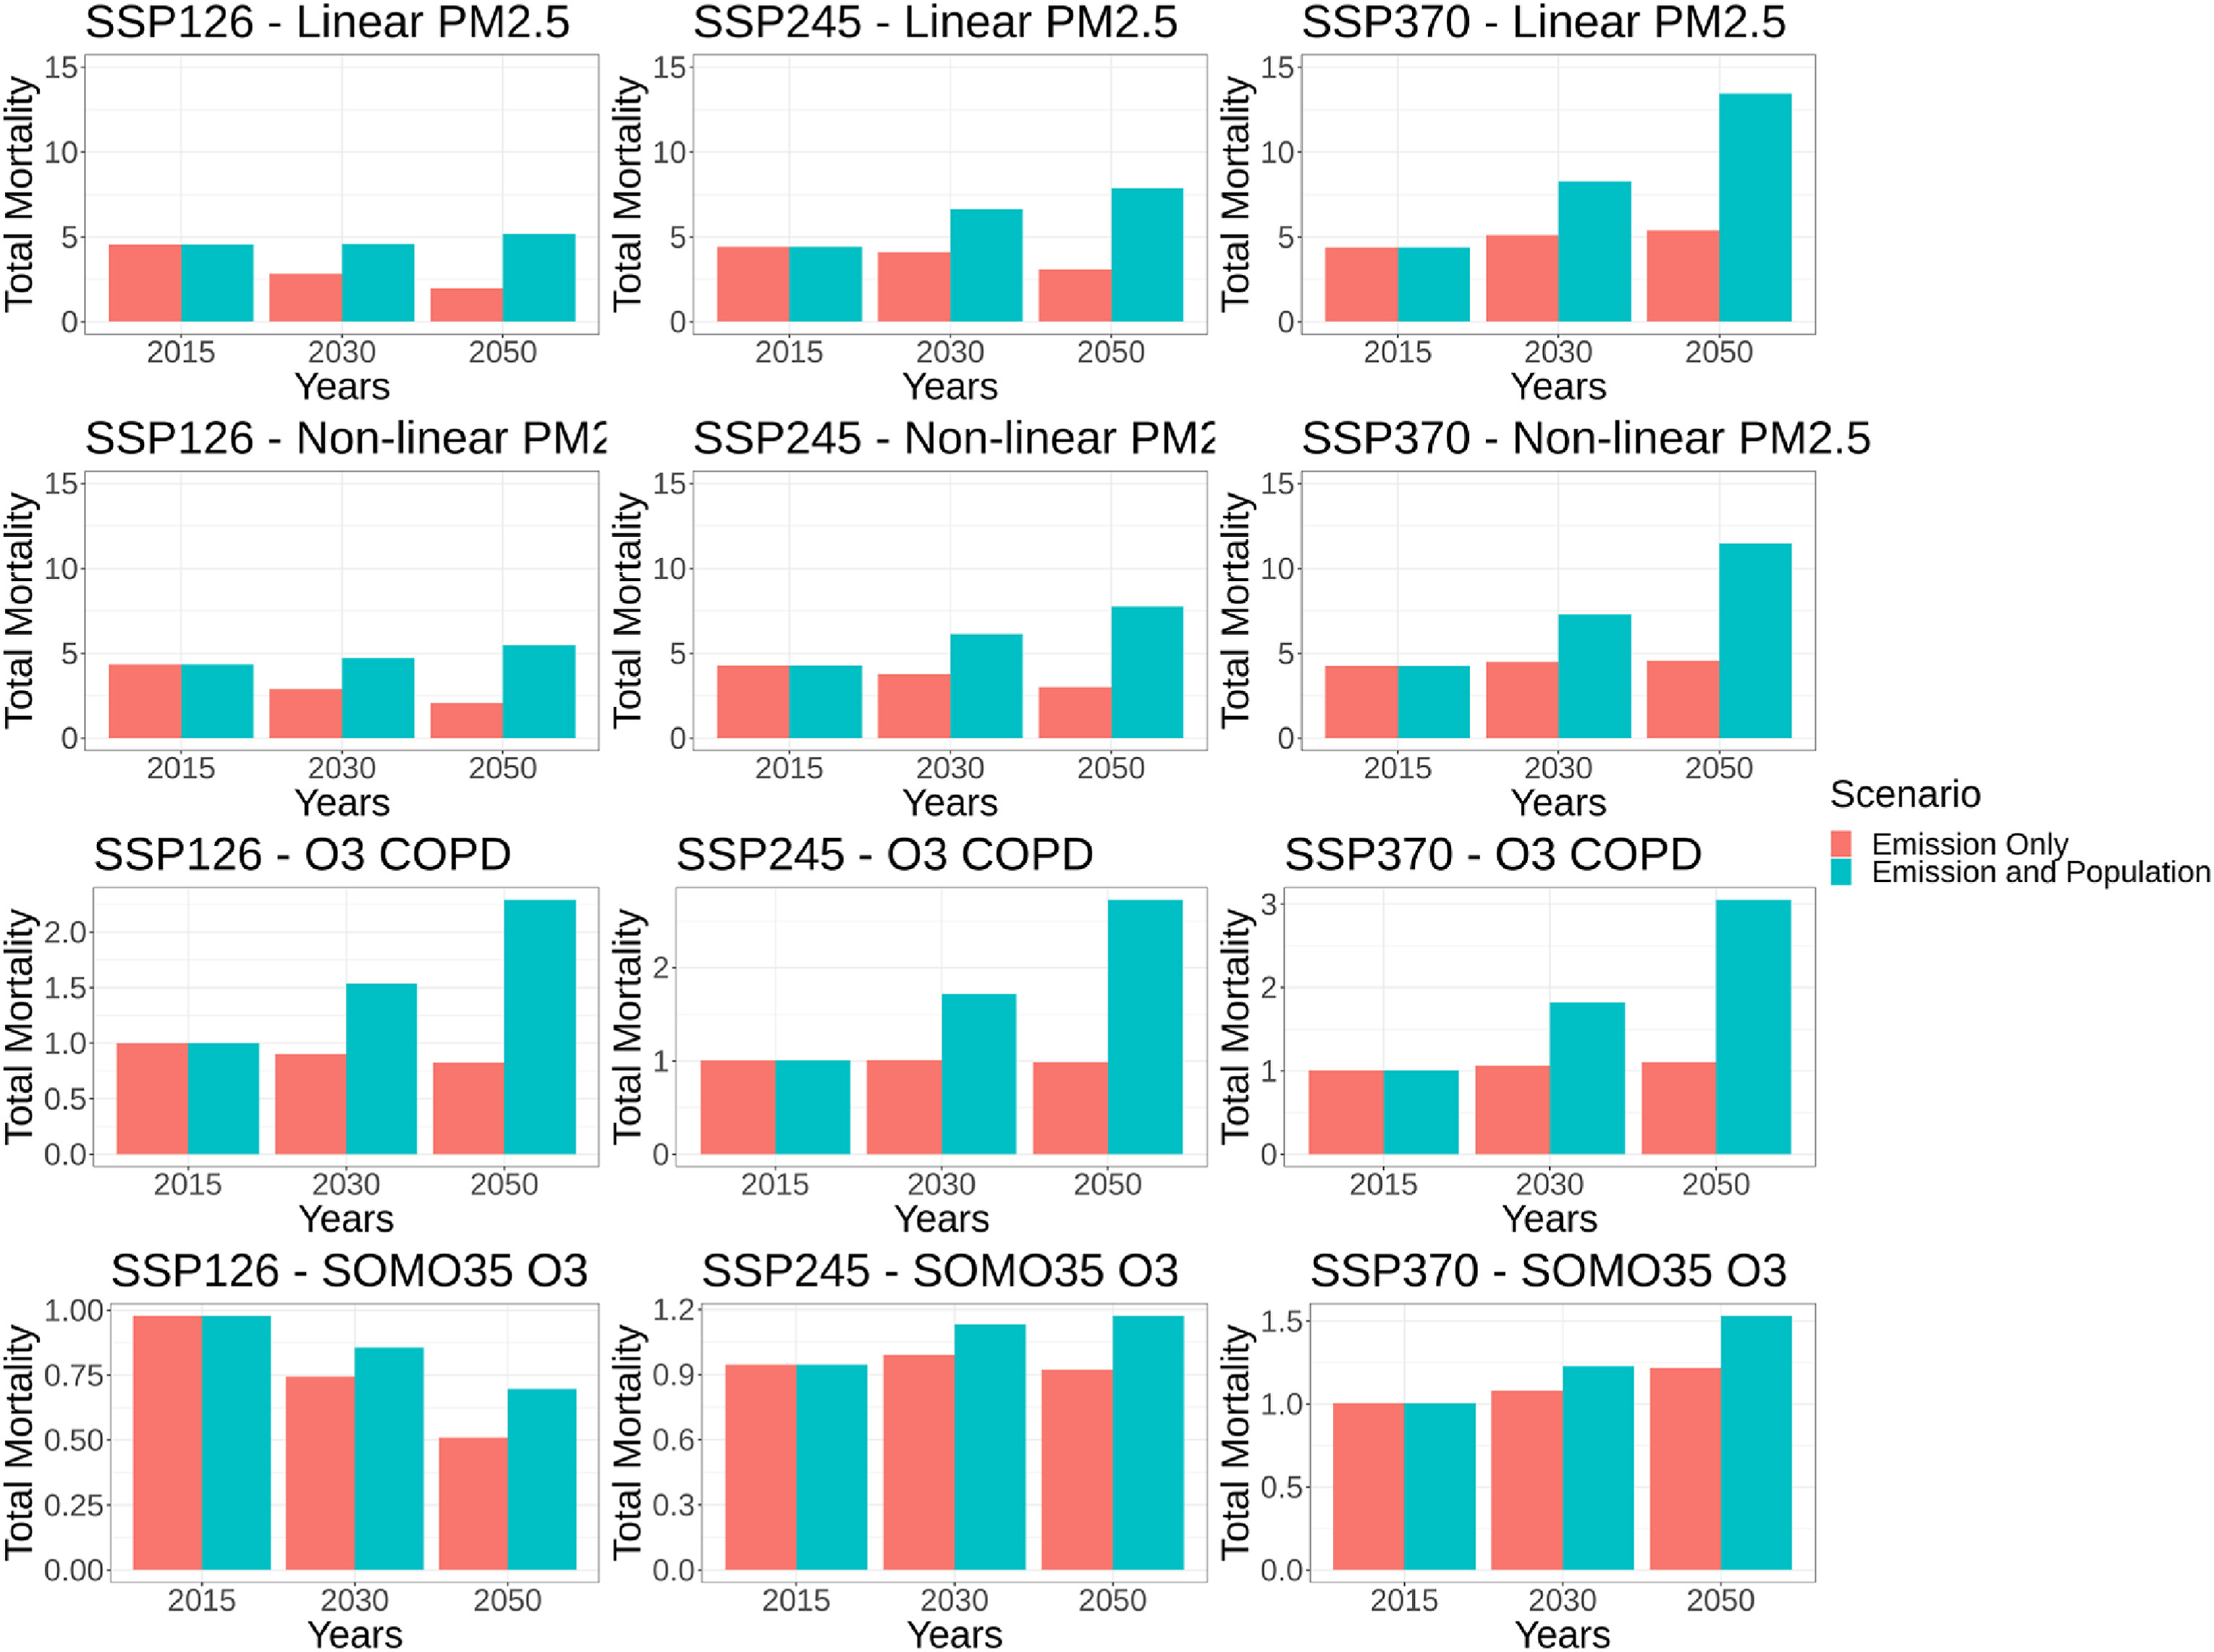
The graphs show present-day (2015) and future (2030 and 2050) global PM2.5 and O3-related premature mortalities across three different emission scenarios (SSP1-2.6, SSP2-4.5, and SSP3-7.0) under fixed 2015 (impact of emission changes only) and changing population (impact of both emission and population changes). Figure from Im et al., 2023.
The simulation results show that surface PM2.5 and O3 pollutants lead to more than 7 million premature deaths globally, with 2/3 originating in Asia. Emissions mitigation can yield up to 70% improvement by 2050 compared to today. However, in some hotspot regions an increasing and aging population can hamper this improvement, leading to an overall increase in mortality even under the most ambitious emission mitigation scenarios.

A doctor treats a young boy suffering from asthma. Air pollution can make asthma symptoms worse or trigger asthma attacks. Other diseases associated with air pollution include cardiovascular diseases such as stroke and ischemic heart disease and respiratory diseases such as chronic obstructive pulmonary disease (COPD) and lower respiratory infection. Photo by Drazen – stock.adobe.com.
“The findings suggest that an increasing and aging population can hamper the efforts to decrease human-made emissions,” Im said. “Therefore, air quality and public health regulations should take this factor into account.”
In follow-up, Im noted that the collaboration between AU and GISS continues along several fronts. These include sometimes running simulations simultaneously on AU and NCCS supercomputers to double the computational resources and speed up the generation of output.
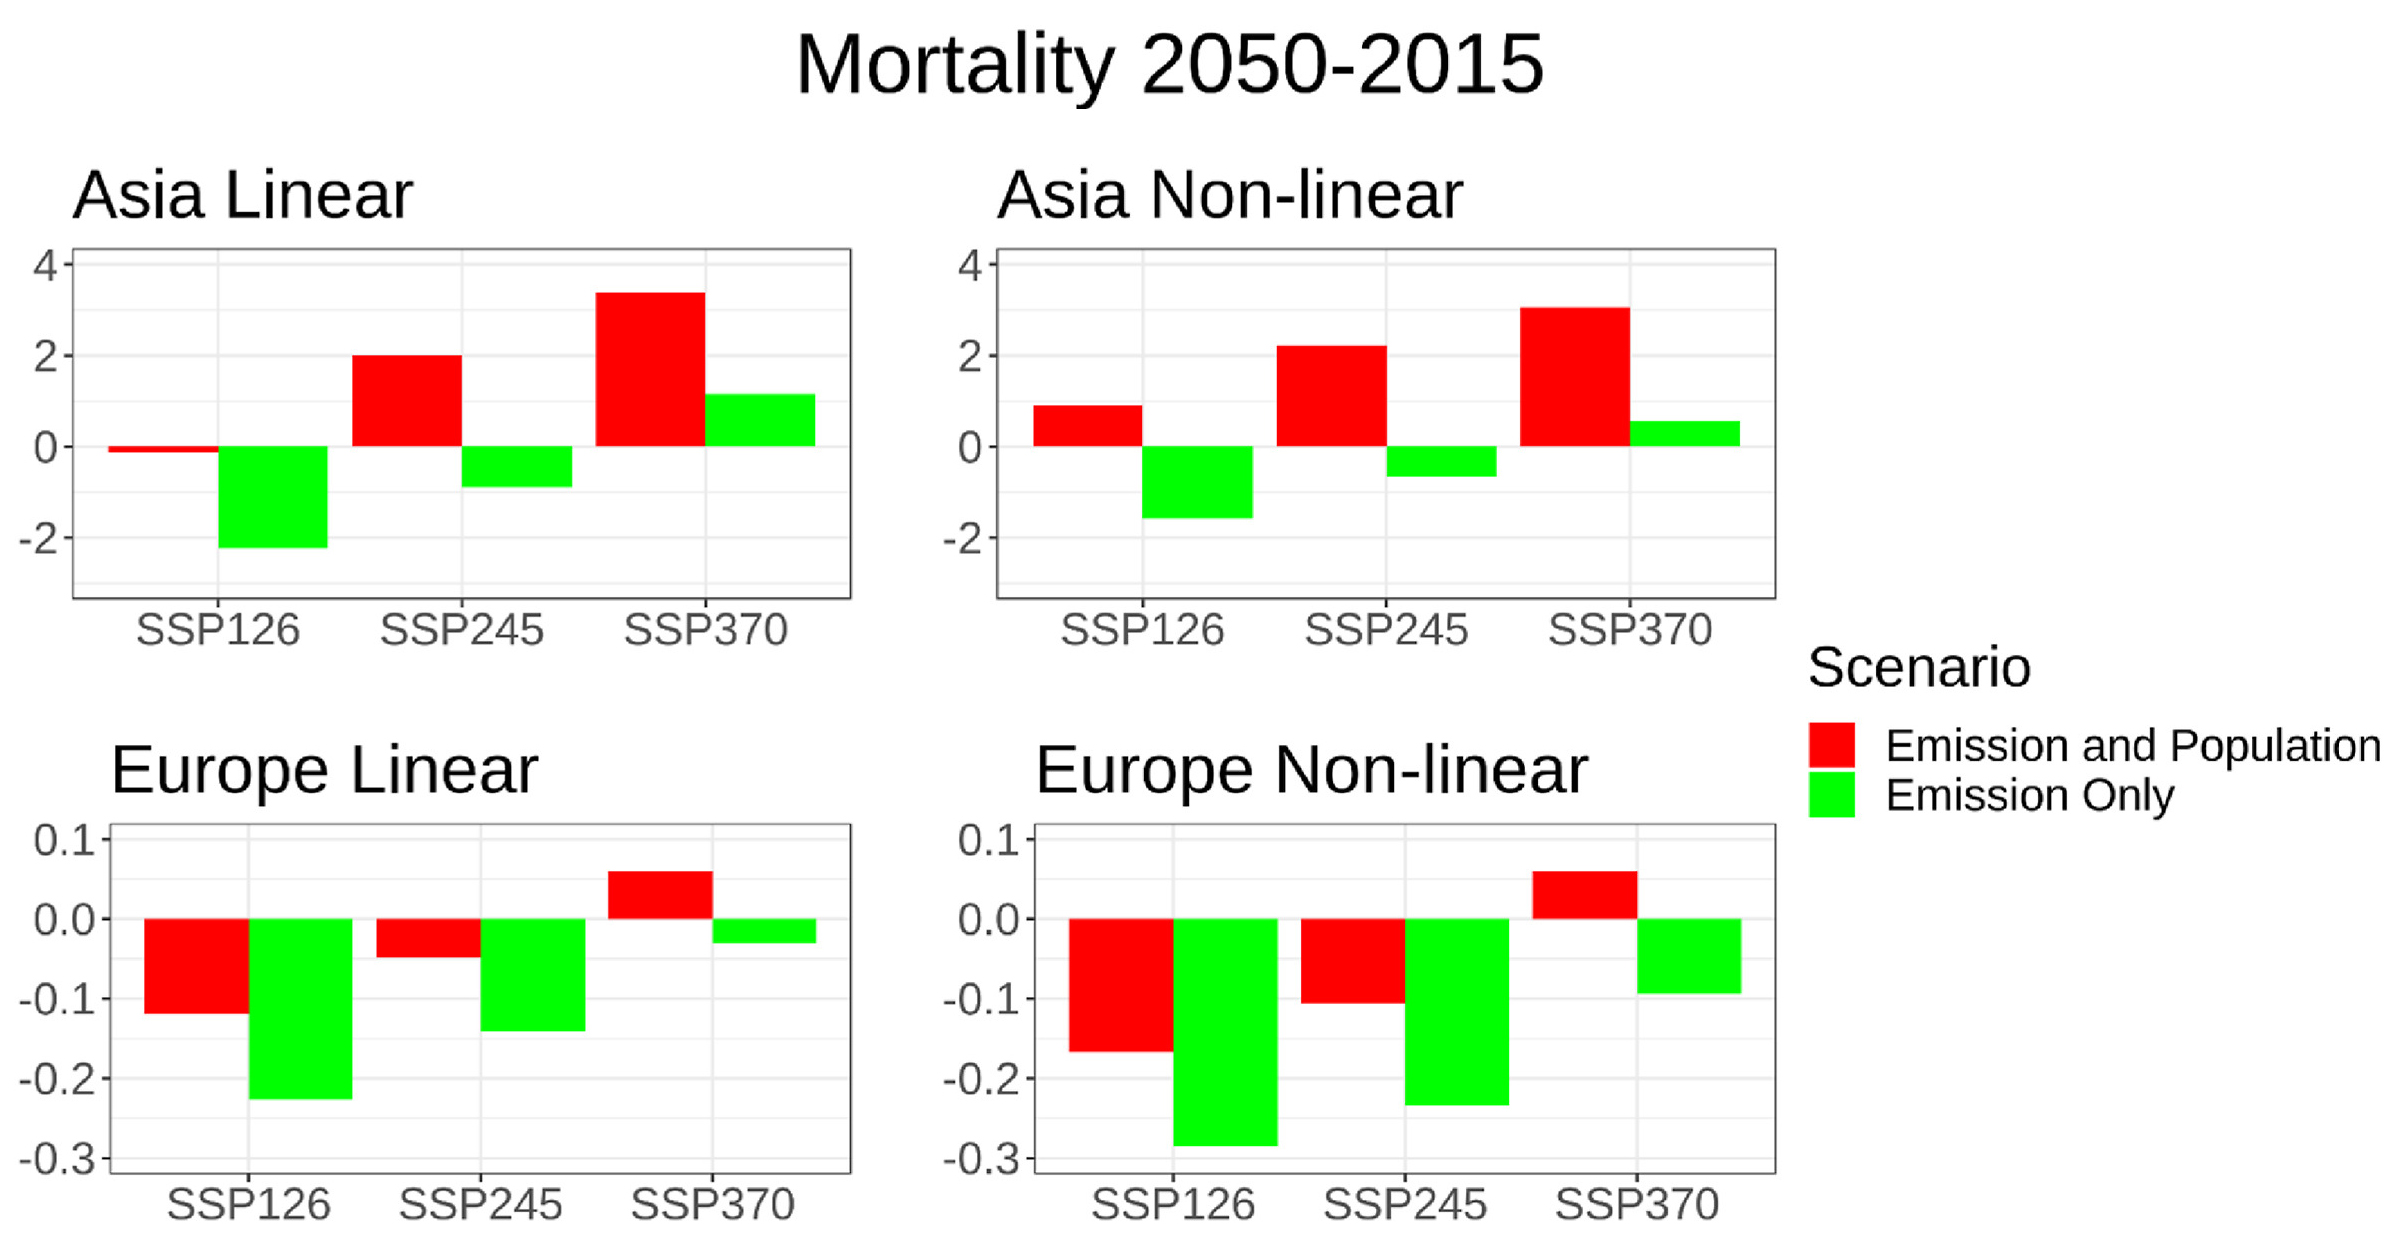
The graph shows the difference in total (PM2.5+O3) premature deaths from the future (2050) compared to the present (2015) due to changes in emissions only (green) and changes in both emissions and population (red) for Asia (top panel) and Europe (lower panel), estimated using linear (left panel) and non-linear (right panel) methods. Figure from Im et al., 2023.
Related Links
- Im, U., S.E. Bauer, L.M. Frohn, C. Geels, K. Tsigaridis, and J. Brandt, 2023: Present-Day and Future PM2.5 and O3-Related Global and Regional Premature Mortality in the EVAv6.0 Health Impact Assessment Model. Environmental Research, 216, no. 4, 114702, doi:10.1016/j.envres.2022.114702.
- “GISS and NCCS Contribute to CMIP6 International Climate Model Intercomparison Project,” NCCS Highlight, 4/30/21.
Jarrett Cohen, NASA Goddard Space Flight Center
April 26, 2023