NCCS ADAPT Science Cloud Helps Reveal Mercury’s Mysteries
The first complete map of Mercury came from stitching together thousands of images captured by the NASA MESSENGER spacecraft's wide-angle camera. New insights from another MESSENGER instrument — the Mercury Laser Altimeter — are coming from a recent study performed at the NASA Center for Climate Simulation. Images, visualization, and animation courtesy of NASA/Johns Hopkins University Applied Physics Laboratory/Carnegie Institution of Washington. Video by NASA Goddard Space Flight Center.
Data analysis employing the NASA Center for Climate Simulation (NCCS) ADAPT Science Cloud for nearly 1 year has revealed never-before-seen details of the planet Mercury’s geodetic properties — the evolution over time of its geometric shape and orientation in space.

Stefano Bertone
“Because of Mercury’s peculiar orbital dynamics, studying its orientation in space, gravity, and topography allows us to learn a lot about its internal structure,” said Stefano Bertone, Assistant Research Scientist affiliated with NASA Goddard’s Planetary Geology, Geophysics, & Geochemistry Laboratory and the University of Maryland, Baltimore County (UMBC). “For example, we can determine the relative size of its core, mantle, and crust, along with their densities and state, all of which are still largely debated in the planetary science community.”
Bertone led a research team involving scientists from NASA Goddard and UMBC, who published their study results in the Journal of Geophysical Research – Planets.
As the smallest planet in our solar system (slightly larger than Earth’s Moon) and the closest to the Sun, Mercury is difficult to reach and orbit. “Only two probes have visited Mercury so far, and we base our knowledge mostly on data collected over its Northern Hemisphere,” Bertone said. One of those probes is NASA’s MESSENGER spacecraft.
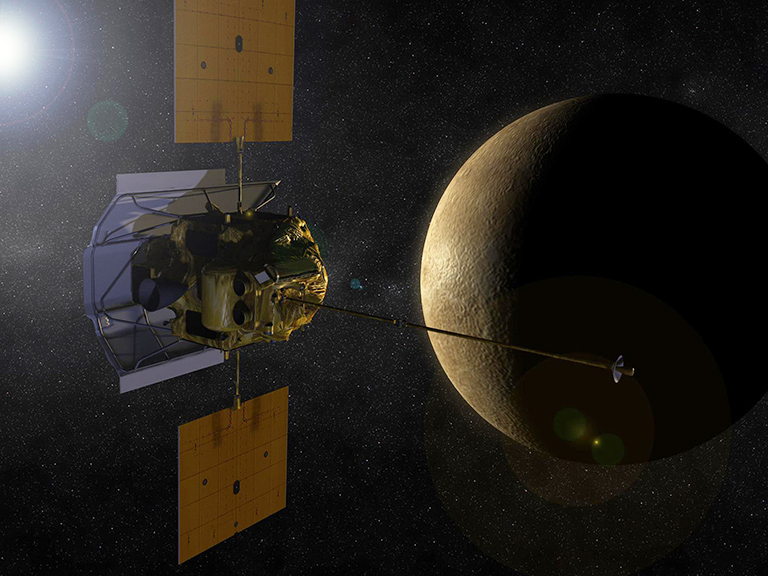
Artist’s concept of NASA’s MESSENGER spacecraft. Illustration by NASA.
For their study, Bertone and colleagues analyzed data collected by MESSENGER’s Mercury Laser Altimeter (MLA) over the years 2008 and 2011–2015. Like altimeters used to probe the Earth and other planets, MLA works by shooting a laser at Mercury’s surface and measuring how long it takes for the light to bounce back to determine surface elevation.
According to Bertone, the geographically limited nature of MLA’s dataset makes geodetic measurements more challenging to derive and interpret. That limitation calls for innovative approaches to squeeze the most from the available data and solve eventual inconsistencies among results by different groups and techniques.
Consequently, Bertone and colleagues focused on 3.5 million MLA “crossovers,” observations of the same surface locations taken at separate times. Running the open-source PyXover software (developed by Bertone) on ADAPT at NCCS, the scientists used the differences in measured elevation to reduce data interpretation errors by adding constraints from a complementary dataset.
Impact: This independent analysis of MESSENGER's Mercury Laser Altimeter crossovers updates scientific knowledge of Mercury’s orientation and tidal response, bringing important information about the planet’s internal structure such as the size of its core and its internal level of differentiation. The results also serve as an improved baseline for the upcoming European Space Agency BepiColombo mission to Mercury.
Sun-raised solid tides resulting in deformations of Mercury’s surface were detected for the first time through months-long, multi-stage analysis. The study also yielded a more precise orientation of the planet’s rotational axis, indicating an outer core with a larger radius than suggested by earlier, gravity-based estimates. "This new information is key to constraining models of Mercury’s formation and the solar system’s evolution, and these results have triggered new discussions and analysis within the research community,” Bertone said.
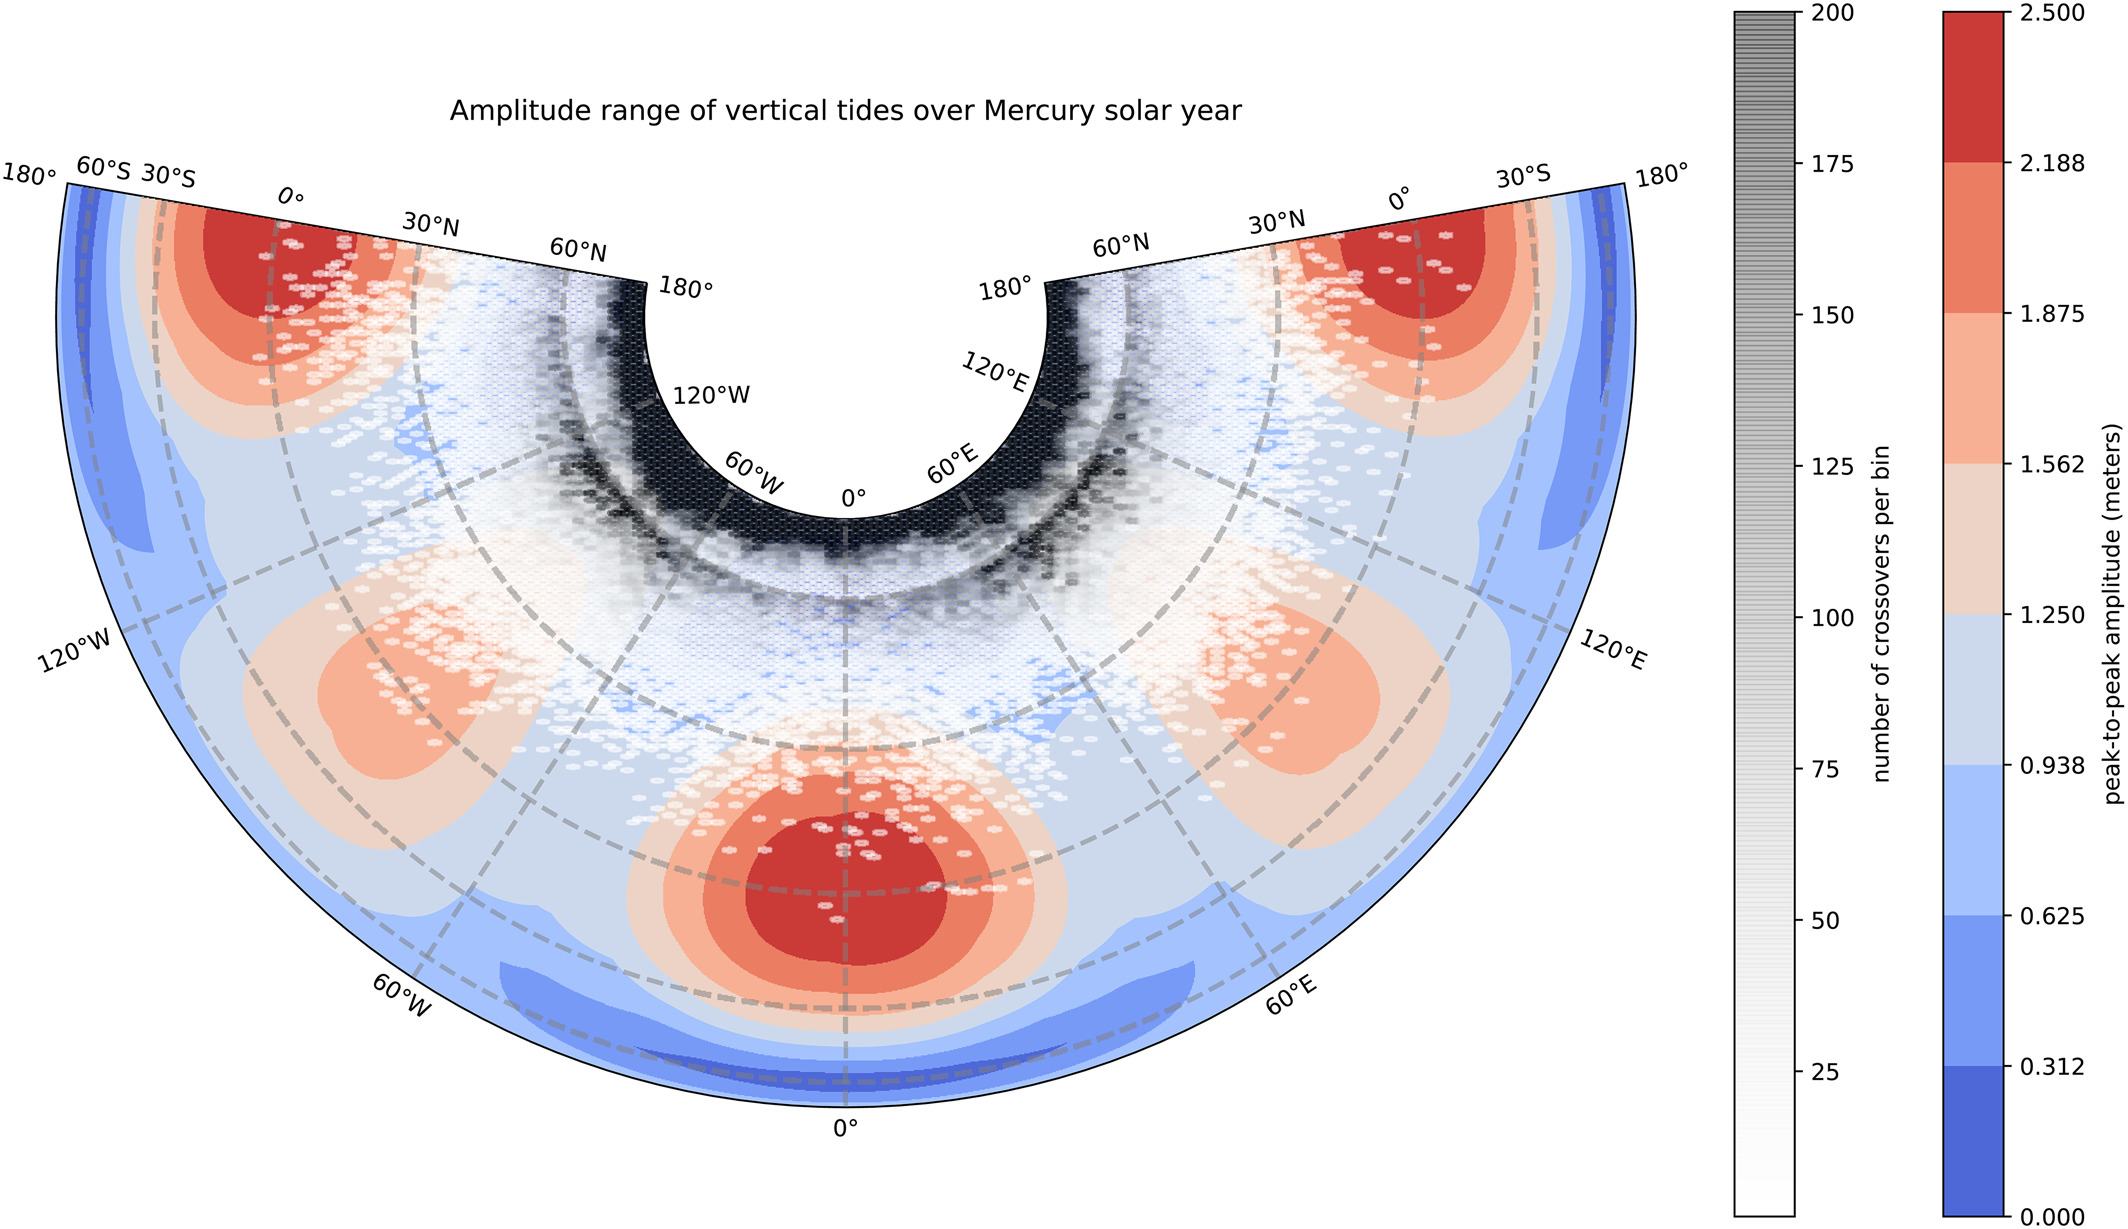
The map shows the geographical distribution of MESSENGER Mercury Laser Altimeter (MLA) crossovers (shown in grays; denser areas are darker) superimposed on Mercury tidal deformations (shown in colors ranging from blue to red) and integrated over a Mercury year. The comparison shows that most MLA crossovers lie in regions where tidal deformations are below 1 meter. Figure from Bertone et al., 2021.
Vital to the study’s success was ADAPT’s flexible computing environment, where the analysis routines consumed 5 to 15 nodes at a time. Bertone noted that “it was especially helpful to be able to test different scenarios and code versions without having to worry too much about the amount of computational time. That allowed us to explore more options, improve and debug the code, and cross-check results.”
More broadly, “altimetry crossover setup and analysis are heavy processing tasks seldom applied to planetary datasets because of their huge computational burden,” Bertone said. “Such analysis wouldn’t have been possible — at least including all MLA data — in a reasonable timeframe without the NCCS ADAPT resources.”

Left: The graph displays ranges for Mercury’s outer core radius in kilometers (km) from previous studies based on gravity measurements (Genova et al., 2019; gray curve) and surface radar observations (Hauck et al., 2013; blue curve) compared to Bertone et al.’s 2021 study based on MLA altimetry data (red curve). Graph adapted from Bertone et al., 2021.
Right: The graphical representation shows Mercury’s internal structure having a solid inner core and molten outer core as indicated by Genova et al., 2019. Illustration by NASA Goddard.
Related Links
- Bertone, S., E. Mazarico, M.K. Barker, S.J. Goossens, T.J. Sabaka, G.A. Neumann, and D.E. Smith, 2021: Deriving Mercury Geodetic Parameters with Altimetric Crossovers from the Mercury Laser Altimeter (MLA). Journal of Geophysical Research – Planets, 126, e2020JE006683, doi:10.1029/2020JE006683.
- Genova, A., S. Goossens, E. Mazarico, F.G. Lemoine, G.A. Neumann, W. Kuang, T.J. Sabaka, S.A. Hauck II, D.E. Smith, S.C. Solomon, and M.T. Zuber, 2019: Geodetic Evidence That Mercury Has a Solid Inner Core. Geophysical Research Letters, 46, 3625–3633, doi:10.1029/2018GL081135.
- Hauck, S.A., J.-L. Margot, S.C. Solomon, R.J. Phillips, C.L. Johnson, F.G. Lemoine, E. Mazarico, T.J. McCoy, S. Padovan, S.J. Peale, M.E. Perry, D.E. Smith, and M.T. Zuber, 2013: The Curious Case of Mercury's Internal Structure. Journal of Geophysical Research: Planets, 118, 1204–1220, doi:10.1002/jgre.20091.
- BepiColombo Mission to Mercury, European Space Agency.
- NASA Visualization Explorer: Hypercolor Mosaic, Mar. 21, 2013.
Jarrett Cohen, NASA Goddard Space Flight Center