August 26, 2014
Mapping the Moon with GRAIL
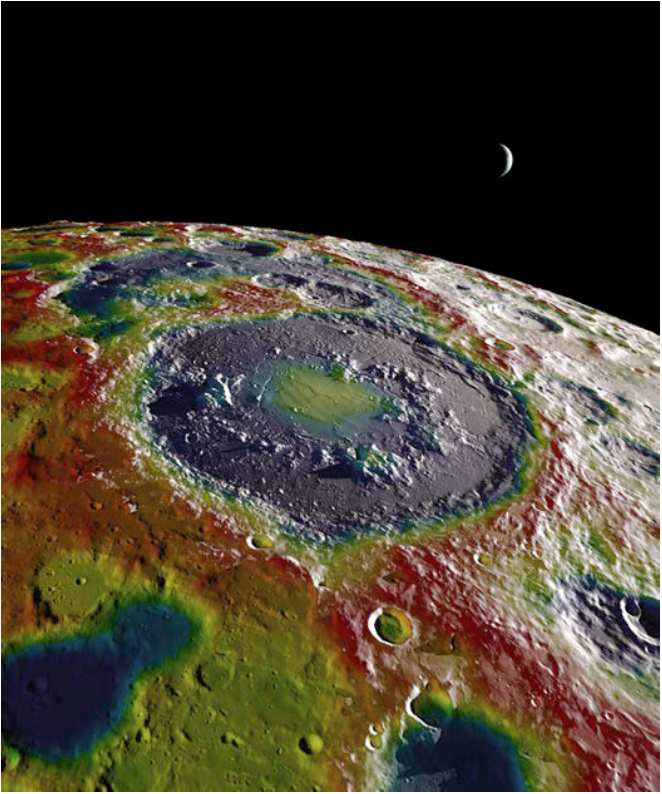
south pole region based on data from the
Gravity Recovery and Interior Laboratory (GRAIL)
overlaid on terrain from the
Lunar Reconnaissance Orbiter (LRO).
Research by Sander Goossens et al. (2014).
Visualization by Ernie Wright (USRA).
Although NASA crashed the two Gravity Recovery and Interior Laboratory (GRAIL) satellites into the Moon when their flight mission ended in December 2012, their collected data is still revealing lunar secrets through gravity maps created using NASA Center for Climate Simulation (NCCS) resources.
“GRAIL enables the highest-resolution satellite-based gravity maps of any planet,” said Sander Goossens, assistant research scientist in NASA Goddard Space Flight Center’s Planetary Geodynamics Laboratory. Using these maps, Goossens and collaborators are modeling and understanding the Moon’s crustal structure like never before.
GRAIL’s primary mission lasted from March to May 2012, with a mean altitude of 55 kilometers above the Moon’s surface. An extended mission from late August to mid-December 2012 lowered the mean altitude to 23 kilometers and added orbits at 20 and 11 kilometers over the last 9 days. Previous gravity measuring satellites at the Moon were hampered by the lack of far-side tracking and/or too high an altitude. “The data GRAIL has delivered us is unprecedented in terms of altitude coverage and precision, and it is truly global,” Goossens said.
The mapping process starts with a computer model of the Moon’s gravity field. Custom software combines this model with the raw GRAIL data—precise measurements of the velocities between the mission’s twin orbiting satellites Ebb and Flow. “We use a brute force approach and take the full model into account and try to estimate it at once,” Goossens said. To reduce errors the GRAIL modeling team iterates this procedure, feeding the model back into the data five to 10 times.
Memory and processing needs for these large models are daunting. Using 6 terabytes of memory and 4,080 processor-cores on the NCCS Discover supercomputer, finishing the iterations for one map still takes several months. Among other support, Goossens credits NCCS for fine-tuning the team’s software code, expediting job execution, and putting their work on separate disk nodes optimized for maximum input/output speeds.
Analyzing an earlier 13-kilometer-resolution gravity map, the GRAIL science team found that lunar gravity and topography correlate up to an extraordinary 98 percent of the time. Such a strong correlation means researchers can subtract topography data from NASA’s Lunar Reconnaissance Orbiter (LRO) to uncover subsurface details. In a February 2013 special GRAIL issue of the journal Science, a paper based on that technique reveals a Moon’s crust battered by impacts and therefore as less dense and more porous than believed. Another Science paper describes linear gravity anomalies indicating a magma ocean formed dikes and other subsurface structures in the early Moon.
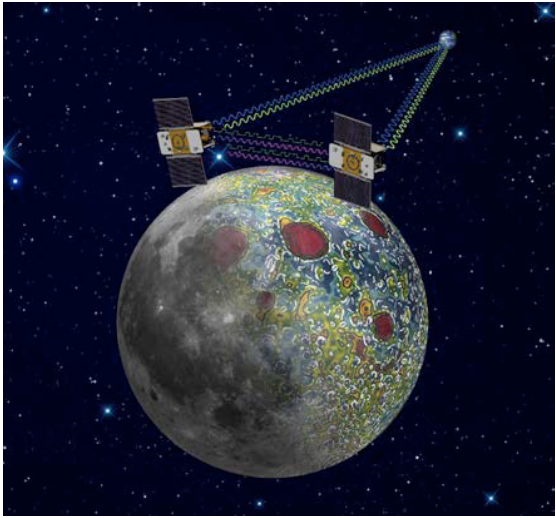
Moon in tandem to measure the planet’s gravity.
Image by NASA/JPL-Caltech.
The GRAIL modeling team’s latest results are a global gravity map at 6-kilometer resolution and a local map of the south pole region at 5-kilometer resolution—both published this May in Geophysical Research Letters. Ongoing research focuses on crustal structures and crater distribution. Goossens noted that the south pole is of particular scientific interest because there are craters in permanent shadow. “There might be ice there. We don’t have the resolution to see that yet,” he said.
The impact of the gravity maps reaches beyond the GRAIL science team. The maps get fed into the LRO orbit determination for more exact positioning of the altimeter and high-resolution cameras, helping to improve LRO science products. NASA also releases the gravity maps and the raw data to the public 6 months after publication.
Meanwhile, the modeling team is processing a 5-kilometer global map that they hope to complete by the end of 2014. With NCCS upgrading the Discover supercomputer this fall, Goossens envisions using even higher resolution. “There are several things we want to do to exhaust the GRAIL data,” Goossens said.
Jarrett Cohen
NASA Goddard Space Flight Center
Research Paper
Goossens, S., et al. (2014), “High-Resolution Local Gravity Model of the South Pole of the Moon from GRAIL Extended Mission Data,” Geophysical Research Letters, Volume 41, 3367–3374, doi:10.1002/2014GL060178.
Lemoine, F. G., et al. (2014), “GRGM900C: A Degree 900 Lunar Gravity Model from GRAIL Primary and Extended Mission Data,” Geophysical Research Letters, Volume 41, 3382–3389, doi:10.1002/2014GL060027.
ContactsSander GoossensAssistant Research Scientist Planetary Geodynamics Laboratory NASA Goddard Space Flight Center/ University of Maryland, Baltimore County sander.j.goossens@nasa.gov 301.614.6499 |
Dan Duffy High-Performance Computing Lead NASA Center for Climate Simulation NASA Goddard Space Flight Center daniel.q.duffy@nasa.gov 301.286.8830 |
|
More InformationGRAIL: Gravity Recovery and Interior LaboratoryGRAIL Gravity Map for the Cover of Geophysical Research Letters |
LRO: Lunar Reconnaissance Orbiter | |