NCCS Enables Realistic Simulations of Melting Snowflakes
to Better Understand Rainstorms and Estimate Rainfall

Top: Typhoon Mawar as captured on May 22, 2023, by a combination of NASA’s IMERG precipitation product and the Global Precipitation Measurement (GPM) Core Observatory. GPM’s array of active and passive sensors is ideal for monitoring and studying tropical cyclones. These sensors can observe both frozen precipitation in the upper levels of the storm and its transition to liquid precipitation closer to Earth’s surface. Left bottom color bar: Shades of cyan represent low amounts of frozen precipitation; shades of purple represent high amounts of frozen precipitation. Right bottom color bar: Shades of green represent low amounts of liquid precipitation; shades of red represent high amounts of liquid precipitation. Visualization by Alex Kekesi and Greg Shirah, NASA's Scientific Visualization Studio. Data provided by the joint NASA/JAXA GPM mission.
Although we most notice snow when it hits the ground, snow is also present in the upper levels of rainstorms — including tropical cyclones like Typhoon Mawar above — and melts into rain as it falls through the atmosphere.
Two of NASA’s primary tools for studying rainstorms are Earth-observing satellites and computer models. As shown in the Typhoon Mawar visualization, Global Precipitation Measurement (GPM) Core Observatory satellites can observe precipitation as it transitions from snow to rain. Numerical weather prediction models assimilate data from GPM and other sources every 6 hours to run forecasts with the most realistic possible starting conditions.
Weather models currently represent precipitation with statistical estimates called parameterizations because precipitation physics occurs at scales much smaller than model grid boxes that are at best a few kilometers wide. Due to computer power and other limitations, models are not yet capable of simulating the physics of individual hydrometeors (whether solid particles like snowflakes or liquid ones like raindrops) within a storm.

Craig Pelissier
“Our work on simulating melting snowflakes is an effort to improve our understanding of how rainfall forms in the upper atmosphere, which will hopefully also lead to improved rainfall estimates,” said Craig Pelissier, Advanced Software Technology Group (ASTG) Lead in NASA Goddard Space Flight Center’s Computational and Information Sciences and Technology Office (CISTO). Pelissier helps lead SnowMeLT, an ongoing NASA effort to simulate melting snow at the scale of single snowflakes — a key component in understanding how precipitation is formed and in estimating rainfall.
“The physical processes involved in melting snowflakes are quite complicated,” Pelissier said. “They involve heat transfer, phase transition, meltwater that moves rapidly due to strong surface tension, and ice fractures that move within the forming raindrop near the end of the melting process. Capturing the dynamics accurately is quite challenging, and our approach requires the use of large supercomputers.”
Enter the Discover supercomputer at the NASA Center for Climate Simulation (NCCS), which is enabling complex, realistic simulations of melting snowflakes. Joining Pelissier in this effort are scientists William Olson, Kwo-Sen Kuo, Adrian Loftus, Robert Schrom, and Ian Adams from NASA Goddard’s Mesoscale Atmospheric Processes Laboratory. Their latest published results appear in the Journal of the Atmospheric Sciences.

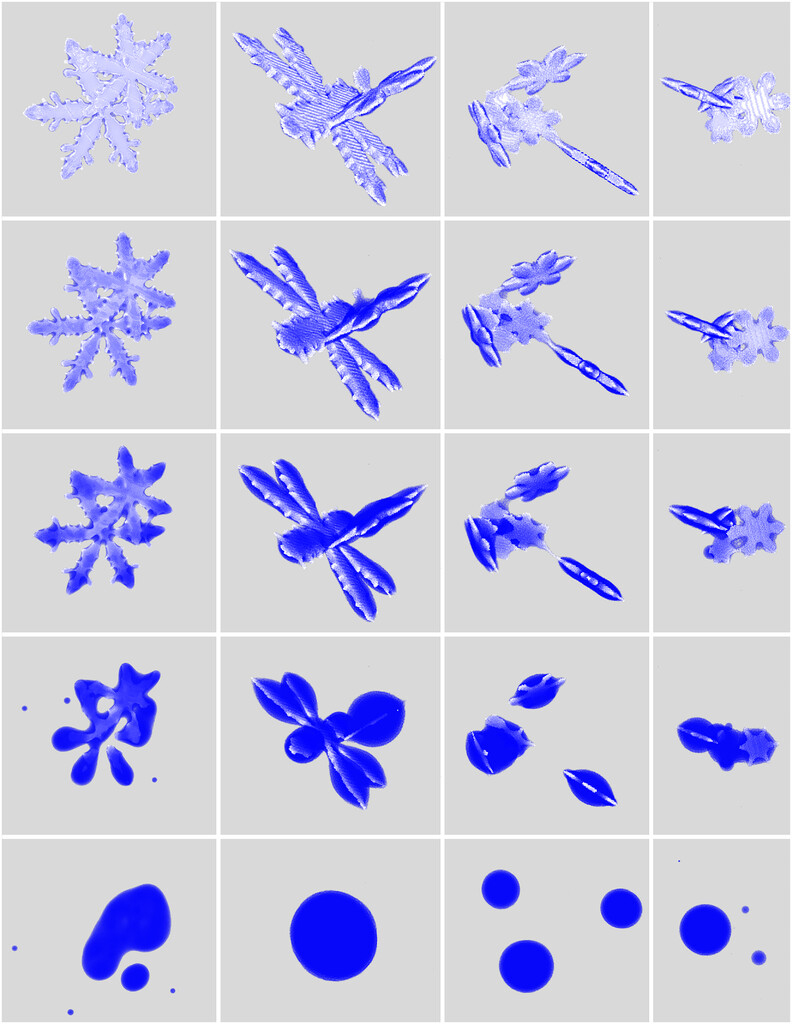
Snapshots of the three largest simulated snowflakes from the NASA Snow Particle and Scattering Property (NASA OpenSSP) database: (left) 1, (center) 2, and (right) 3 at (top) 30%, (top middle) 50%, (middle) 70%, (bottom middle) 90%, and (bottom) 100% melted. See the table below for snowflake parameters. Figure from Pelissier et al., 2023.
To tackle this scientific challenge, Pelissier and collaborators developed both a simulation software code and a database of synthetic snowflakes to use with it. “In the last few years, collections of realistic, synthetically generated snowflakes have been successfully used to improve modeling capabilities. SnowMeLT aims to derive melting hydrometeors from these snowflakes to more accurately capture the formation of rainfall and improve rainfall estimates,” Pelissier said.
The SnowMeLT (Snow Meshless Lagrangian Technique) software code simulates the complex microphysics involved in melting a snowflake. The NASA Snow Particle and Scattering Property (NASA OpenSSP) database provides the intricate structures of different snowflake geometries for the SnowMeLT simulations.
Impact: Realistically melting snowflakes is an important step towards understanding how precipitation is formed in rainstorms, which advances the goals of NASA’s Precipitation Measurement Missions and may contribute to an improved representation of precipitation processes in numerical weather prediction model forecasts.
From the nearly 10,000 snowflakes in the NASA OpenSSP database, Pelissier and collaborators chose a set of 11 synthetic snowflakes representing a range of sizes and geometries to demonstrate the SnowMeLT method (see the table below). “We melted a variety of snowflake shapes and sizes, including aggregates — more than one snowflake clumped together,” Pelissier said.
| Snowflake Number |
Diameter (millimeters) |
Mass (milligrams) |
Simulation Timesteps |
Time to Melt (seconds) |
|---|---|---|---|---|
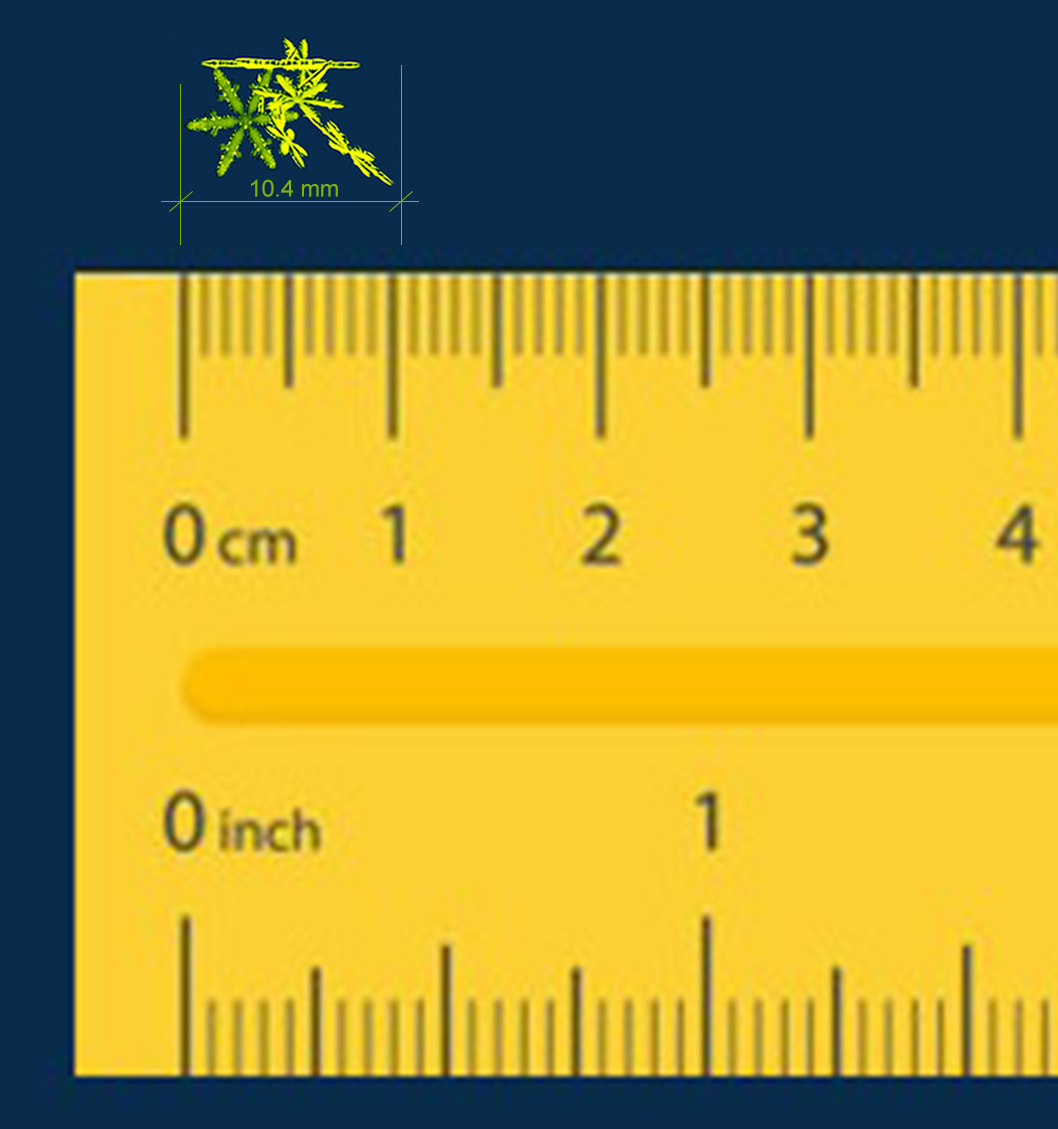
| 1 | 10.4 | 6.872 | 15,072,000 | 929 |
| 2 | 10.5 | 6.429 | 13,984,000 | 866 |
| 3 | 8.51 | 4.342 | 11,008,000 | 686 |
| 4 | 7.83 | 3.692 | 10,432,000 | 659 |
| 5 | 6.10 | 2.251 | 8,576,000 | 530 |
| 6 | 6.11 | 2.111 | 7,904,000 | 490 |
| 7 | 5.35 | 1.490 | 6,624,000 | 411 |
| 8 | 4.61 | 0.856 | 4,768,000 | 313 |
| 9 | 3.21 | 0.495 | 3,840,000 | 238 |
| 10 | 2.80 | 0.367 | 3,232,000 | 200 |
| 11 | 2.08 | 0.184 | 2,144,000 | 133 |
The researchers simulated 11 snowflakes in a variety of shapes and sizes. Table adapted from Pelissier et al., 2023.
Graphic by Sean Keefe, NASA Goddard.
The overall SnowMeLT computing time was dominated by simulations of the larger snowflakes. As shown in the table above and the graphic at right, the largest snowflake in the study was 10.4 millimeters wide and had a mass of 6.872 milligrams. Simulating this snowflake melting required more than 2.2 million ice particles to capture its 3D geometry at 15-micrometer resolution and over 15 million timesteps (time intervals) to completely melt. This single simulation alone ran continuously for more than 2 months using about 1,000 compute cores on the NCCS Discover supercomputer. Overall, the study required those 1,000 cores to run for 4 to 5 months. The simulations produced roughly 1 terabyte of data, housed in Discover’s online disk.
“We did a lot of work to enable SnowMeLT to scale across large CPU-based clusters like Discover,” Pelissier said. “That enabled us to run at the higher resolution and to melt hydrometeors up to 1 centimeter [approximately 0.4 inches] in a reasonable amount of time. For our largest simulated snowflakes, we achieved a speed-up factor of a few hundred times on Discover.”
This video shows the SnowMeLT simulation of a synthetic aggregate snowflake melting into raindrops. Visualization by Craig Pelissier et al.
In terms of science, the simulations produced results along the researchers’ expectations. “We know that meltwater moves from the extremities of melting snowflakes and accumulates at their centers, and that is what we saw,” Pelissier said. “The interesting part will come when we look at the way microwave radiation interacts with the particles and whether that results in more accurate rainstorm models. We are working on this question now.”
The researchers will also be enhancing SnowMeLT microphysics by incorporating processes such as evaporation and riming (when snowflakes get coated in tiny frozen water droplets). Another focus is producing melted hydrometeors across the entire size range found in rainstorms.
“For SnowMeLT to be fully operational, we will need a variety of 25 or more snowflakes that range from a few millimeters to a few centimeters wide. This will not be feasible until we enable SnowMeLT to leverage GPUs,” Pelissier said. Moreover, such simulations will require a few hundred terabytes of mass storage space. “We look forward to our continuing partnership with NCCS as we move SnowMeLT from research to operations,” Pelissier said.

Snapshots of four simulated snowflakes from the NASA OpenSSP database: (left) 4, (left center) 5, (right center) 6, and (right) 7 at (top) 30%, (top middle) 50%, (middle) 70%, (bottom middle) 90%, and (bottom) 100% melted. See the table above for snowflake parameters. Figure from Pelissier et al., 2023.
Snapshots of four simulated snowflakes from the NASA OpenSSP database: (left) 8, (left center) 9, (right center) 10, and (right) 11 at (top) 30%, (top middle) 50%, (middle) 70%, (bottom middle) 90%, and (bottom) 100% melted. See the table above for snowflake parameters. Figure from Pelissier et al., 2023.
RELATED LINKS
- Pelissier, C., W. Olson, K.-S. Kuo, A. Loftus, R. Schrom, and I. Adams, 2023: A Physically-Based, Meshless Lagrangian Approach to Simulate Melting Precipitation. Journal of the Atmospheric Sciences, 80, No. 2, doi:10.1175/jas-d-22-0150.1.
- “NASA Studies Snowflake Melting to Improve Storm System Models,” NASA@SC21.
Jarrett Cohen, NASA Goddard Space Flight Center
August 30, 2023