NASA and NOAA Scientists Develop Method to Create
Continuous Ozone Climate Data Record
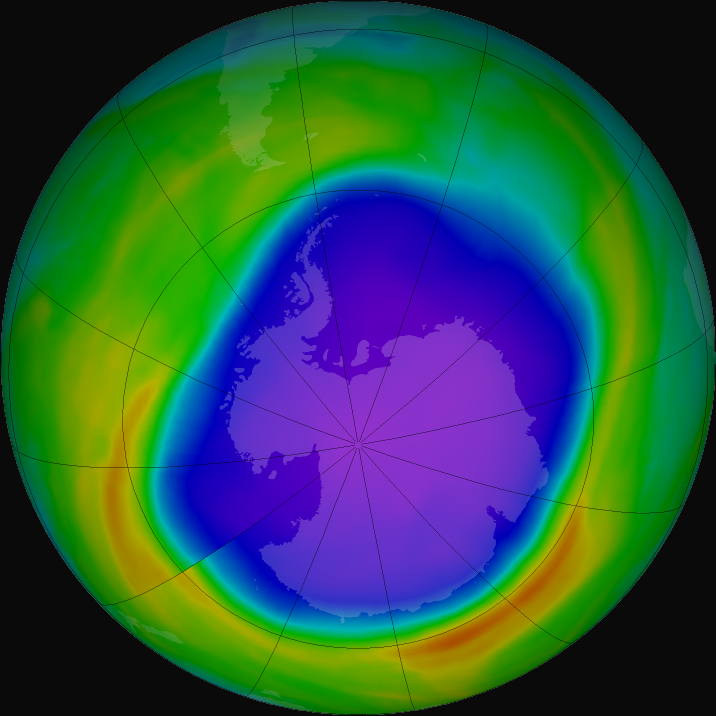
This image shows a false-color view of total ozone over Antarctica on October 7, 2020, about the time the “ozone hole” reaches its annual peak. Purple and blue colors indicate where there is less ozone; yellow and red colors indicate where there is more ozone. Data comes from a variety of sources, including several satellite instruments. Image by NASA.
Stratospheric ozone has been on the road to recovery since the Montreal Protocol of 1987 and its later amendments helped phase out ozone-depleting substances worldwide. One measure of the Montreal Protocol’s success is the general shrinking of the “ozone hole” over Antarctica. A remaining challenge is that the Antarctic ozone hole’s size can vary widely from year to year. For instance, in 2019 the hole was the smallest since 2002, while in 2020 the hole was among the largest since 2005.
Confounded by such variability, the international community needs to continue monitoring ozone globally for years to come. A hindrance to doing that monitoring consistently are systematic biases among datasets from the various ozone-measuring instruments, including the Microwave Limb Sounder (MLS) on NASA’s Aura satellite and the newer Ozone Mapping and Profiler Suite Limb Profiler (OMPS‐LP) on the NASA-NOAA Suomi NPP satellite.
Researchers from NASA’s Goddard Space Flight Center and NOAA’s Earth System Research Laboratories sought a way to reconcile the MLS and OMPS-LP datasets towards the goal of creating a continuous ozone climate data record.

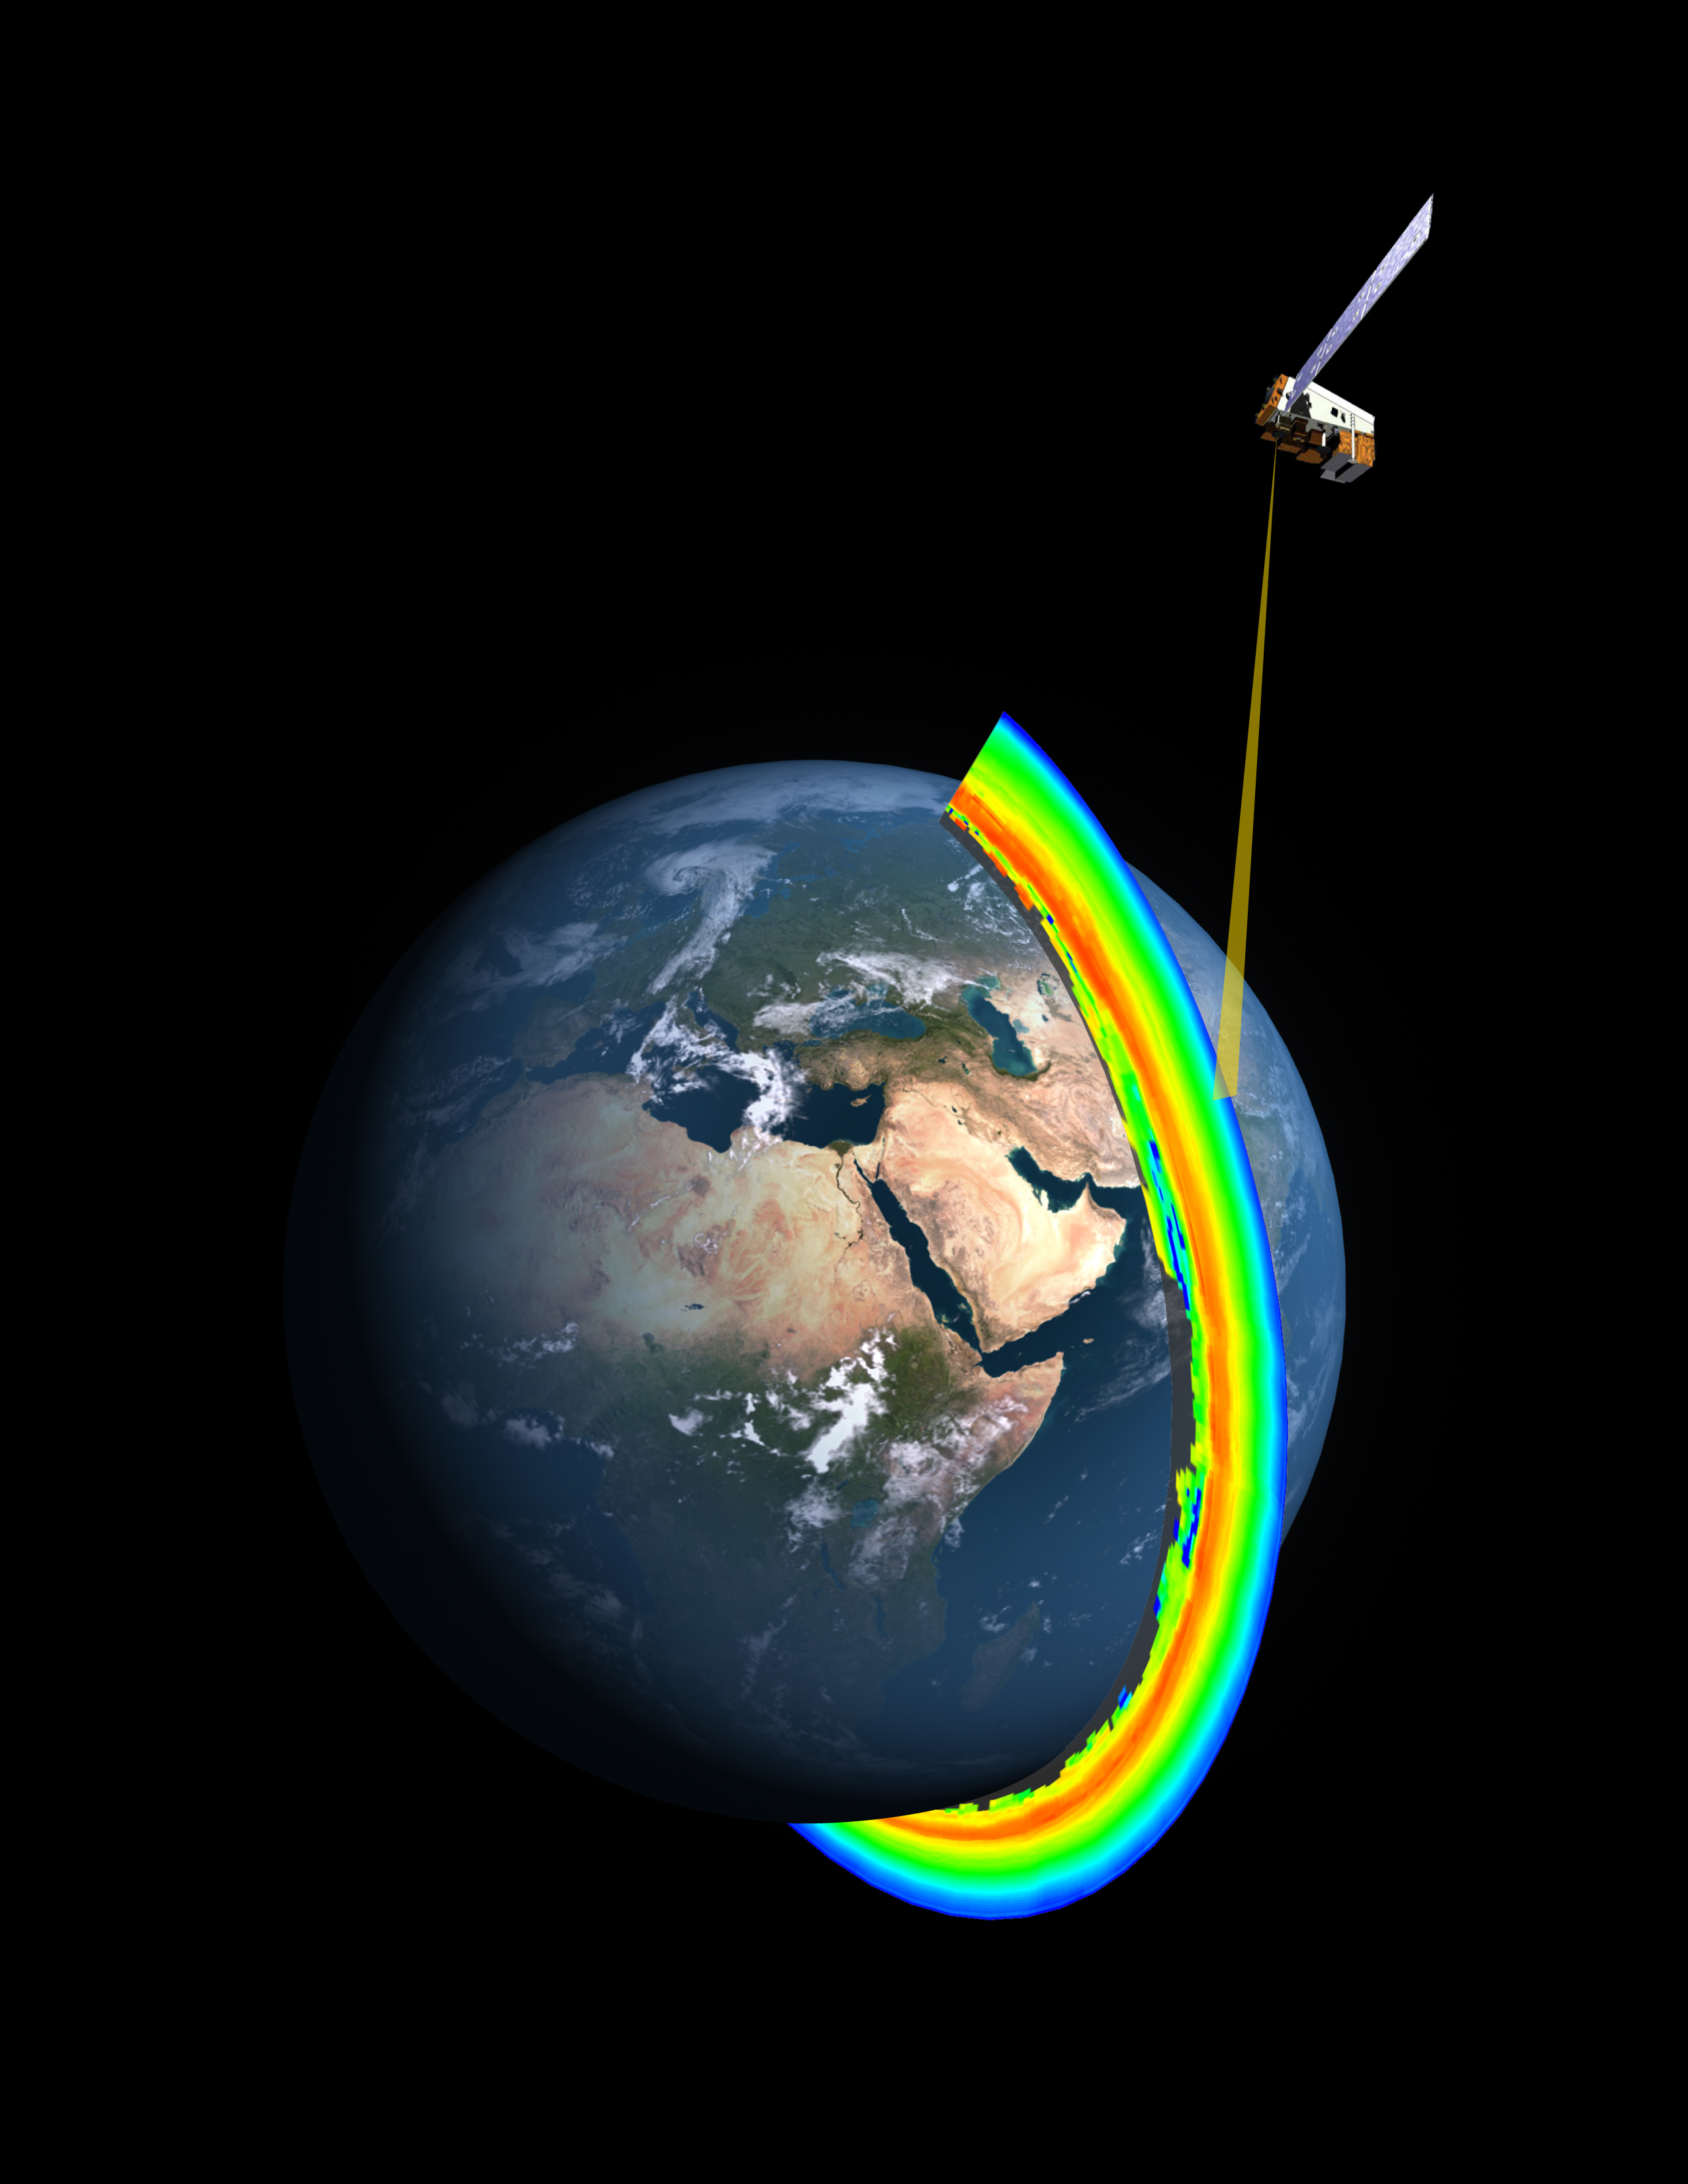
Ozone-measuring instruments include (above) the Microwave Limb Sounder (MLS) onboard the Aura satellite (operating 2004–present) and (right) the Ozone Mapping and Profiler Suite Limb Profiler (OMPS‐LP) onboard the Suomi NPP satellite (operating 2012–present, with missions planned into the 2030s). Images by NASA and NASA/NOAA.
Leveraging NASA Center for Climate Simulation (NCCS) resources, NASA and NOAA researchers ran two experiments assimilating data from each instrument. They used a novel version of the Goddard Earth Observing System Data Assimilation System (GEOS-DAS)—named Constituent DAS (CoDAS)—incorporating the StratChem stratospheric chemistry model and driven by GEOS Modern-Era Retrospective Analysis for Research and Applications, Version 2 (MERRA-2) data. GEOS-DAS, CoDAS, and MERRA-2 are all products of NASA Goddard’s Global Modeling and Assimilation Office (GMAO).
The experiments ran the CoDAS model at approximately 50-kilometer (31-mile) global resolution for the period December 2015–December 2016. These computations employed 480 processor cores on the NCCS Discover supercomputer for a total of nearly 800 hours. Discover’s online disk stored about 875 gigabytes of input data, and NCCS mass storage now houses about 24 terabytes of experiment output data.
Impact: This work achieves an important step toward generating a reanalysis suitable for long‐term ozone monitoring of stratospheric ozone recovery in the 21st century through combined assimilation of diverse high-vertical-resolution satellite datasets.
Data analysis quantified the relative bias between the MLS and OMPS-LP datasets, enabling the NASA-NOAA team to devise a simple homogenization method to minimize the mean difference between the datasets and thus significantly reduce that bias. With the new adjustment applied, the experiments show excellent agreement with each other and with independent validation data, “providing a strong basis for a consistent future multidecadal ozone reanalysis.”
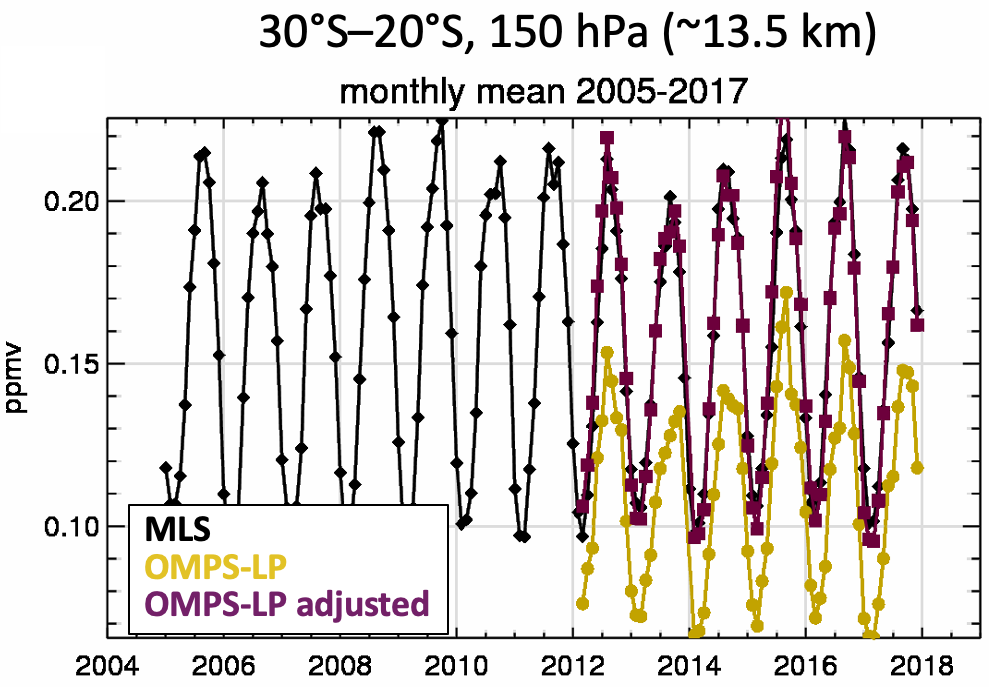
As shown in this graph from the NASA-NOAA study, systematic differences between MLS and OMPS‐LP ozone observations can be corrected by applying a simple adjustment—specifically, a homogenization method—to the OMPS-LP data. Figure adapted from K. Wargan et al., JGR: Atmospheres.
“This study required running long numerical experiments that used a general circulation model and data assimilation system at high spatial resolution,” said GMAO research scientist Krzysztof Wargan. “Analyzing this state-of-the-art system certainly would not have been possible without the high-end computing resources provided by NCCS.”
Next steps include reducing a “long‐term spurious drift” in the OMPS‐LP ozone data and ultimately working towards combined assimilation of MLS, OMPS‐LP, and future ozone datasets—starting from MLS’s 2004 debut—into later versions of the MERRA reanalysis.
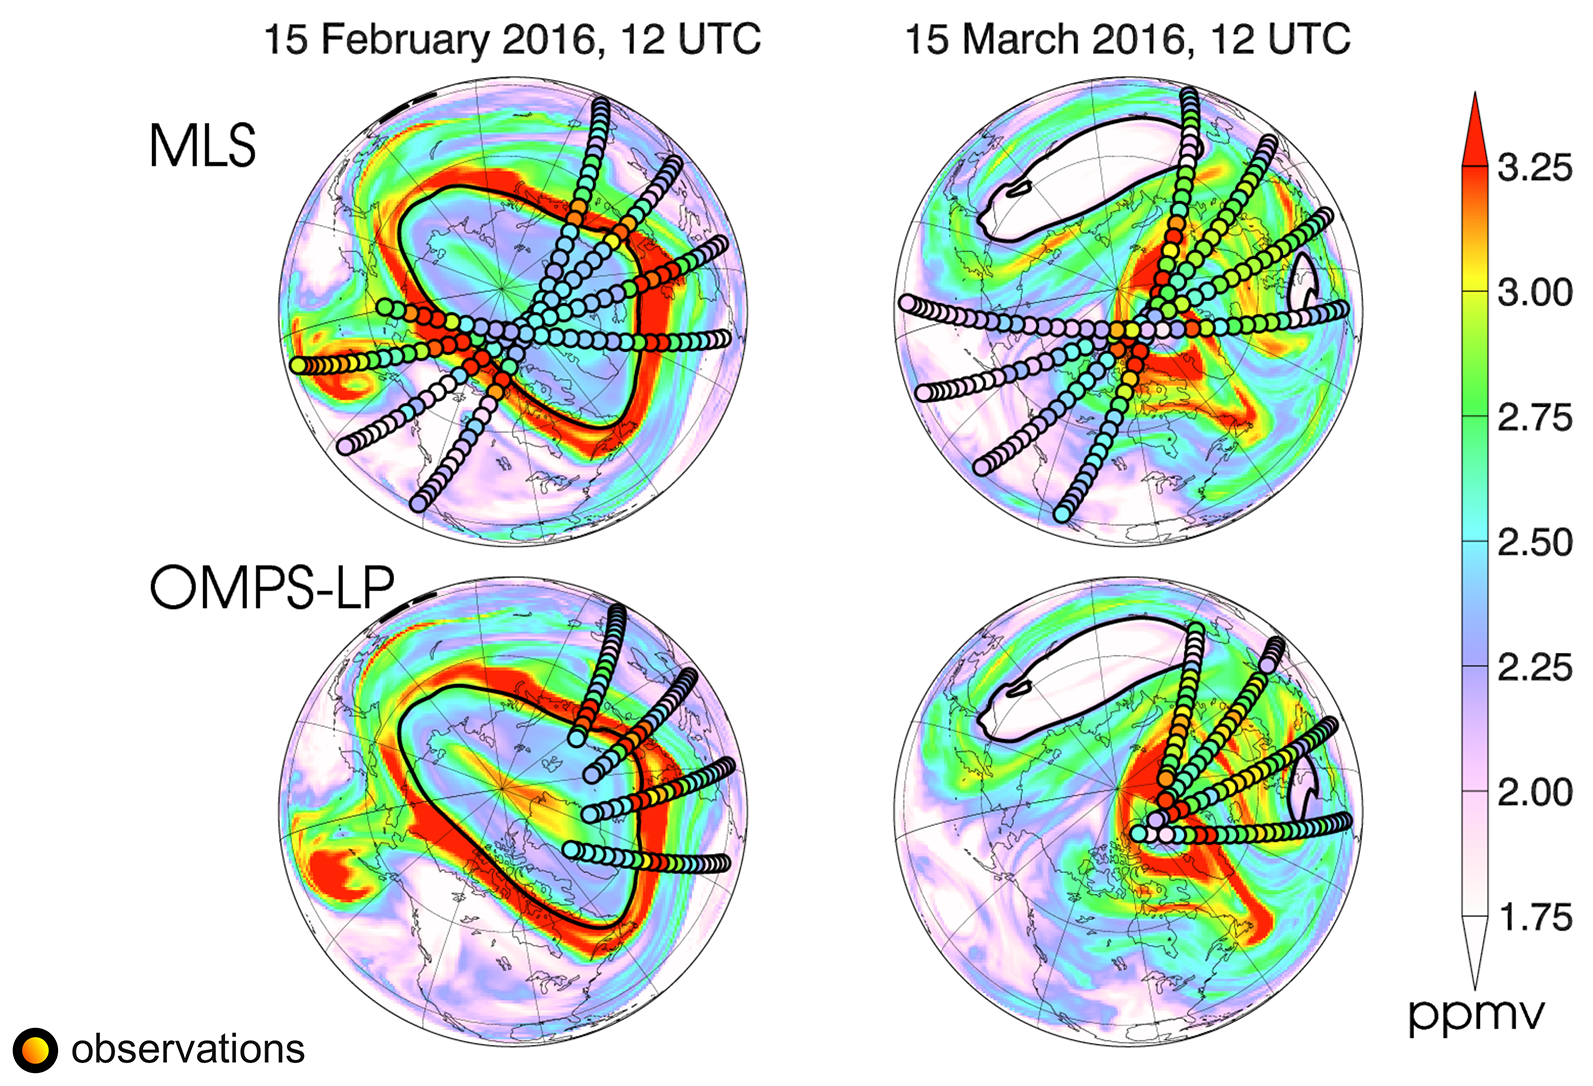
The maps show ozone concentrations at the 480-K potential temperature surface (~19 kilometers above sea level) from assimilation of MLS and OMPS-LP observations during the 2016 winter and spring. Figure adapted from K. Wargan et al., JGR: Atmospheres.
Related Links
- Wargan, K., N. Kramarova, B. Weir, S. Pawson, and S.M. Davis, 2020: Toward a Reanalysis of Stratospheric Ozone for Trend Studies: Assimilation of the Aura Microwave Limb Sounder and Ozone Mapping and Profiler Suite Limb Profiler Data. Journal of Geophysical Research: Atmospheres, 125, no. 4, doi:10.1029/2019jd031892.
- “Developing an Ozone Climate Data Record from Assimilation of High-Resolution Satellite Observations,” GMAO Science Snapshot, 4/20/20.
Jarrett Cohen, NASA Goddard Space Flight Center