NCCS-Hosted Models Probe Fires on Two Continents

A close-up of the Shady Fire’s smoke plume during FIREX-AQ airborne sampling on July 25, 2019. At the time, the Shady Fire had burned more than 2,600 acres of the Salmon-Challis National Forest in east-central Idaho. Photo by Bernadett Weinzierl, University of Vienna.
As massive fires wreaked havoc in the western United States and Australia over recent months, computer models combined with observations were probing the dynamics and far-flung effects of these fires.
Supporting the FIREX-AQ airborne field campaign (July 23–September 4, 2019) to investigate the impact on air quality and climate from wildfires and agricultural fires across the continental U.S., the NASA Center for Climate Simulation (NCCS) Discover supercomputer hosted three models producing forecasts driven by meteorology and emissions data:
- NASA GEOS-FP running at 12-kilometer (km) global resolution, four times per day, on up to 8,400 cores.
- NASA GEOS-CF running at 25-km global resolution, once per day, on 3,416 cores.
- UCLAWRF-Chem running at 4-km resolution over the continental U.S., once per day, on 1,440 cores.
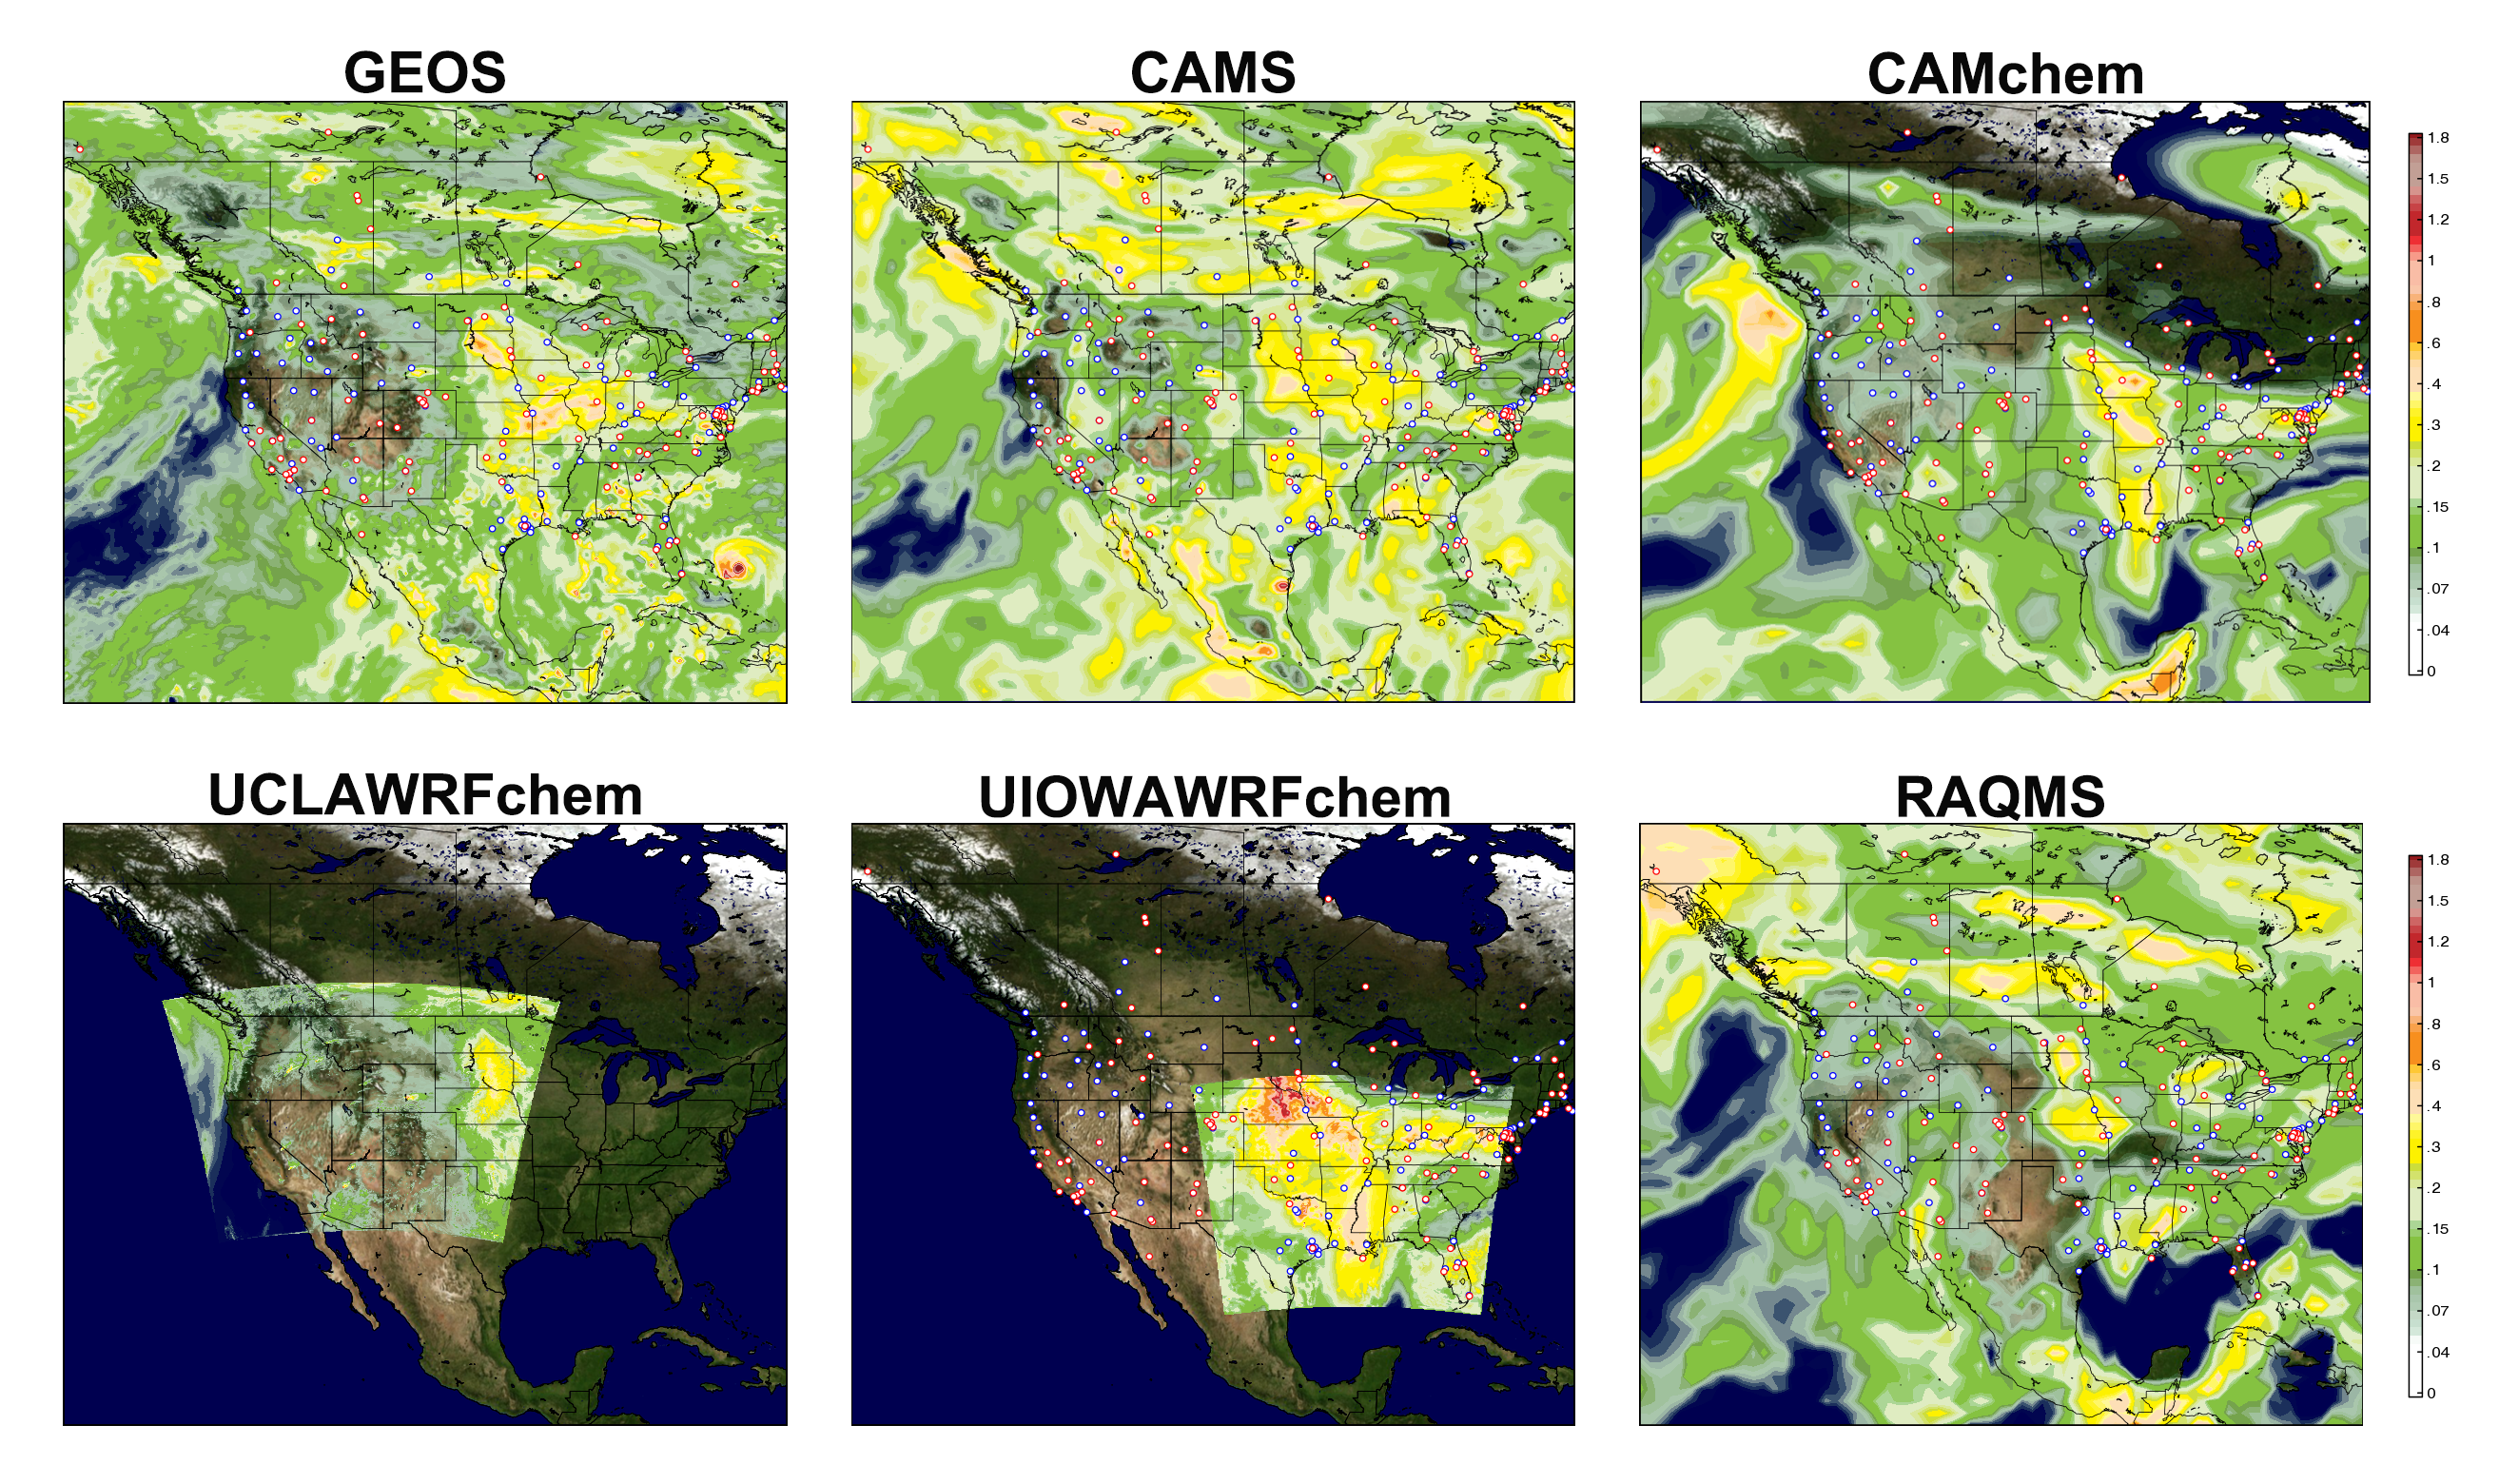
These maps show aerosol optical thickness forecasts initialized on September 1, 2019 from six computer models. Over 60,000 forecast maps per day were available to FIREX-AQ field campaign planners on NCCS-maintained portals.
FIREX-AQ daily flight planners and modeling teams had continual access to near real-time results from these and nine additional models on the NCCS DataPortal and NCCS/NASA Global Modeling and Assimilation Office (GMAO) FLUID visualization portal.
Impact: Model forecasts supported FIREX-AQ flights collecting comprehensive, detailed measurements of trace gas, optical properties, and emissions from wildfires and agricultural fires. These observations will significantly advance our understanding of fire — including emissions, plume rise, chemical transformation, and air quality impacts.
The GMAO/University of California, Los Angeles (UCLA) model team designed and implemented the operational infrastructure for deriving, acquiring, processing, interpolating, and rendering approximately 1 terabyte of model data daily.
“For FIREX-AQ, NASA supercomputing resources have played a significant role in providing computational supports and storage resources, which guaranteed timely forecasts and facilitated visualizations of results to tremendously support the science team during flight planning,” said Xinxin Ye, postdoctoral researcher in the UCLA Department of Atmospheric & Oceanic Sciences.

NASA’s GEOS-FP data assimilation system incorporating NASA MODIS observations captures the global distribution of aerosols from the prominent bushfires in Australia. Aerosol species are dust (orange), sea-salt (blue), nitrates (pink),and carbonaceous (red); brighter regions correspond to higher aerosol amounts. Visualization by William Putman, NASA/Goddard Space Flight Center.
View animation.
Across the Pacific Ocean, continuing GEOS-FP forecasts revealed the extent and impact of the Australian bushfires during the December 2019–January 2020 peak intensity period.
With GEOS-FP assimilating observations of aerosol optical depth and active fires from the NASA MODIS instruments onboard the Terra/Aqua satellites, the model forecasts show extreme regional air quality impacts as well as smoke plumes traveling around the globe as they interacted with weather systems.
In GEOS-FP, deep vertical transport into the upper troposphere and lowermost stratosphere accelerated movement of smoke across the Southern Ocean. Smoke plumes then circumnavigated the globe back around to Australia and became particularly pronounced across the southern Pacific Ocean out to South America.
Related Links
- “Aerosol Optical Thickness Updating Forecast,” NASA Scientific Visualization Studio, Updated Daily.
- “NASA Earth Expeditions: FIREX-AQ,” NASA Blog, July 25–August 23, 2019.
- “Global Transport of Smoke from Australian Bushfires,” GMAO Science Snapshot, January 28, 2020.
Jarrett Cohen, NASA/Goddard Space Flight Center