The SMCE-Built NASA Earth Information System (EIS) Cloud
Computing Platform Enables the Analysis of Flash Droughts
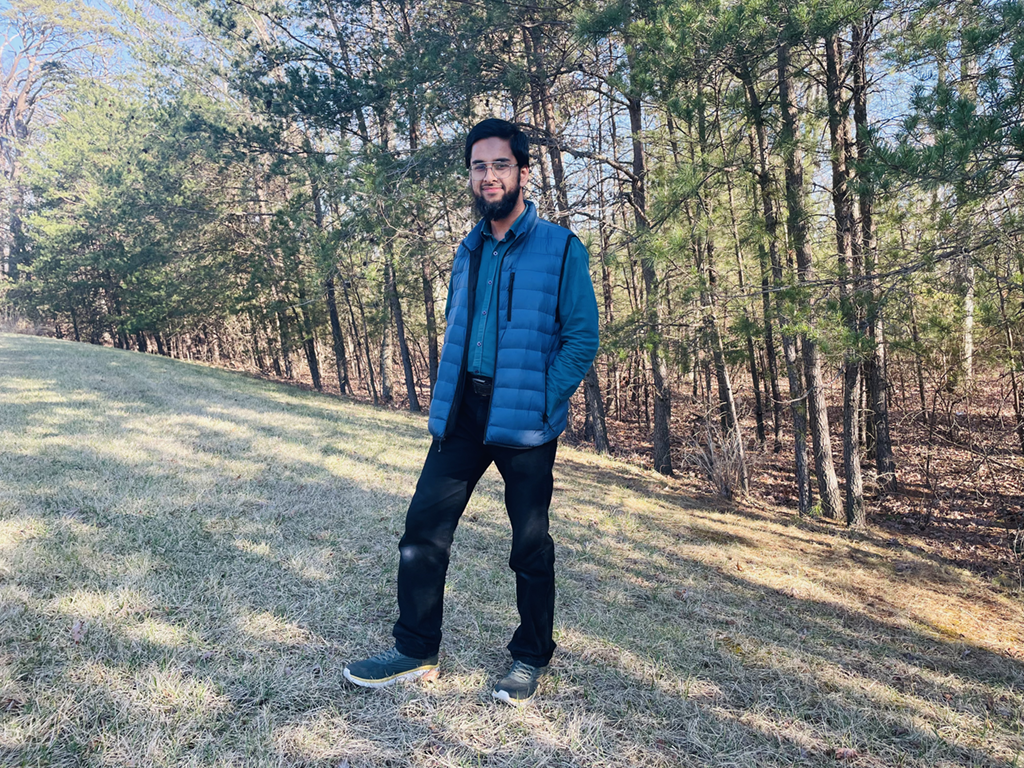
NASA research scientist Dr. Shahryar Ahmad at the NASA Goddard Space Flight Center campus in early 2023. NASA photo.
In this story, we explore flash droughts, explain why they are important phenomena to study, and describe how NASA Research Scientist Dr. Shahryar Ahmad and his colleagues used NASA’s Earth Information System (EIS) cloud computing platform to conduct research on flash droughts in the northern Great Plains. We focus on Ahmad’s current research and outline how NASA’s High-End Computing (HEC) Program and the Science-Managed Cloud Environment (SMCE) helped expedite his team’s collaborative study of flash droughts through the development of the EIS cloud computing platform.
We also explore how Dr. Ahmad’s career led him from Aligarh, India to Seattle, Washington and eventually to Greenbelt, Maryland to work at NASA Goddard Space Flight Center’s Hydrological Sciences Laboratory.
NOAA’s National Weather Service reported in a 2015 Science and Technology Infusion Climate Bulletin that “climate change has further altered the natural pattern of droughts, making them more frequent, longer, and more severe. Since 2000, the western United States is experiencing some of the driest conditions on record.”
Drought is a slow-moving, long-lasting, and widespread scarcity of naturally available water that creates a myriad of negative impacts across the complex network of interacting organisms and their physical environment. Although drought is a normal part of the seasonal cycle of rainfall and temperature in a given climate, it can become a natural disaster that results in significant biological and economic losses.
Click an accordion button below ► to open and close the expanded content.
Drought in the United States is tracked via the U.S. Drought Monitor, a consortium made up of the National Drought Mitigation Center (NDMC) at the University of Nebraska-Lincoln, the U.S. Department of Agriculture (USDA), and the National Oceanic and Atmospheric Administration (NOAA). Each week, an updated map and its data are published on the NMDC website. Below is an example of the U.S. Drought Monitor map as of February 14, 2023.
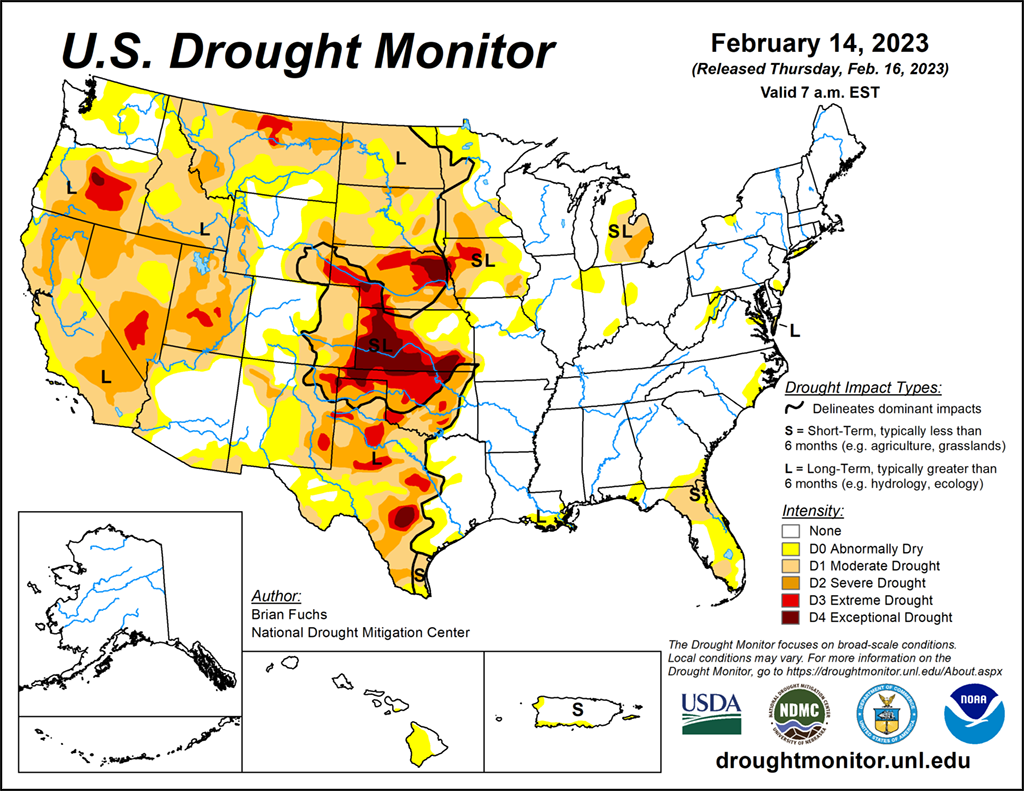
An example of the U.S. Drought Monitor map on February 14, 2023. The U.S. Drought Monitor is jointly produced by the National Drought Mitigation Center at the University of Nebraska-Lincoln, the United States Department of Agriculture, and the National Oceanic and Atmospheric Administration. Map credit: NDMC.
The U.S. Drought Monitor:
Flash droughts are characterized by a rapid-onset decrease in soil moisture that quickly intensifies under the influence of atypical atmospheric conditions such as extreme heat and extreme precipitation deficits. Both of these physical mechanisms result in changes in evapotranspiration (see diagrams below). Hydrological models are developed and continuously refined by scientists to capture near-surface hydrology, subsurface water flow, groundwater recharge, surface runoff, evaporation, transpiration, and evapotranspiration processes. Variation in these components lead to extreme events.
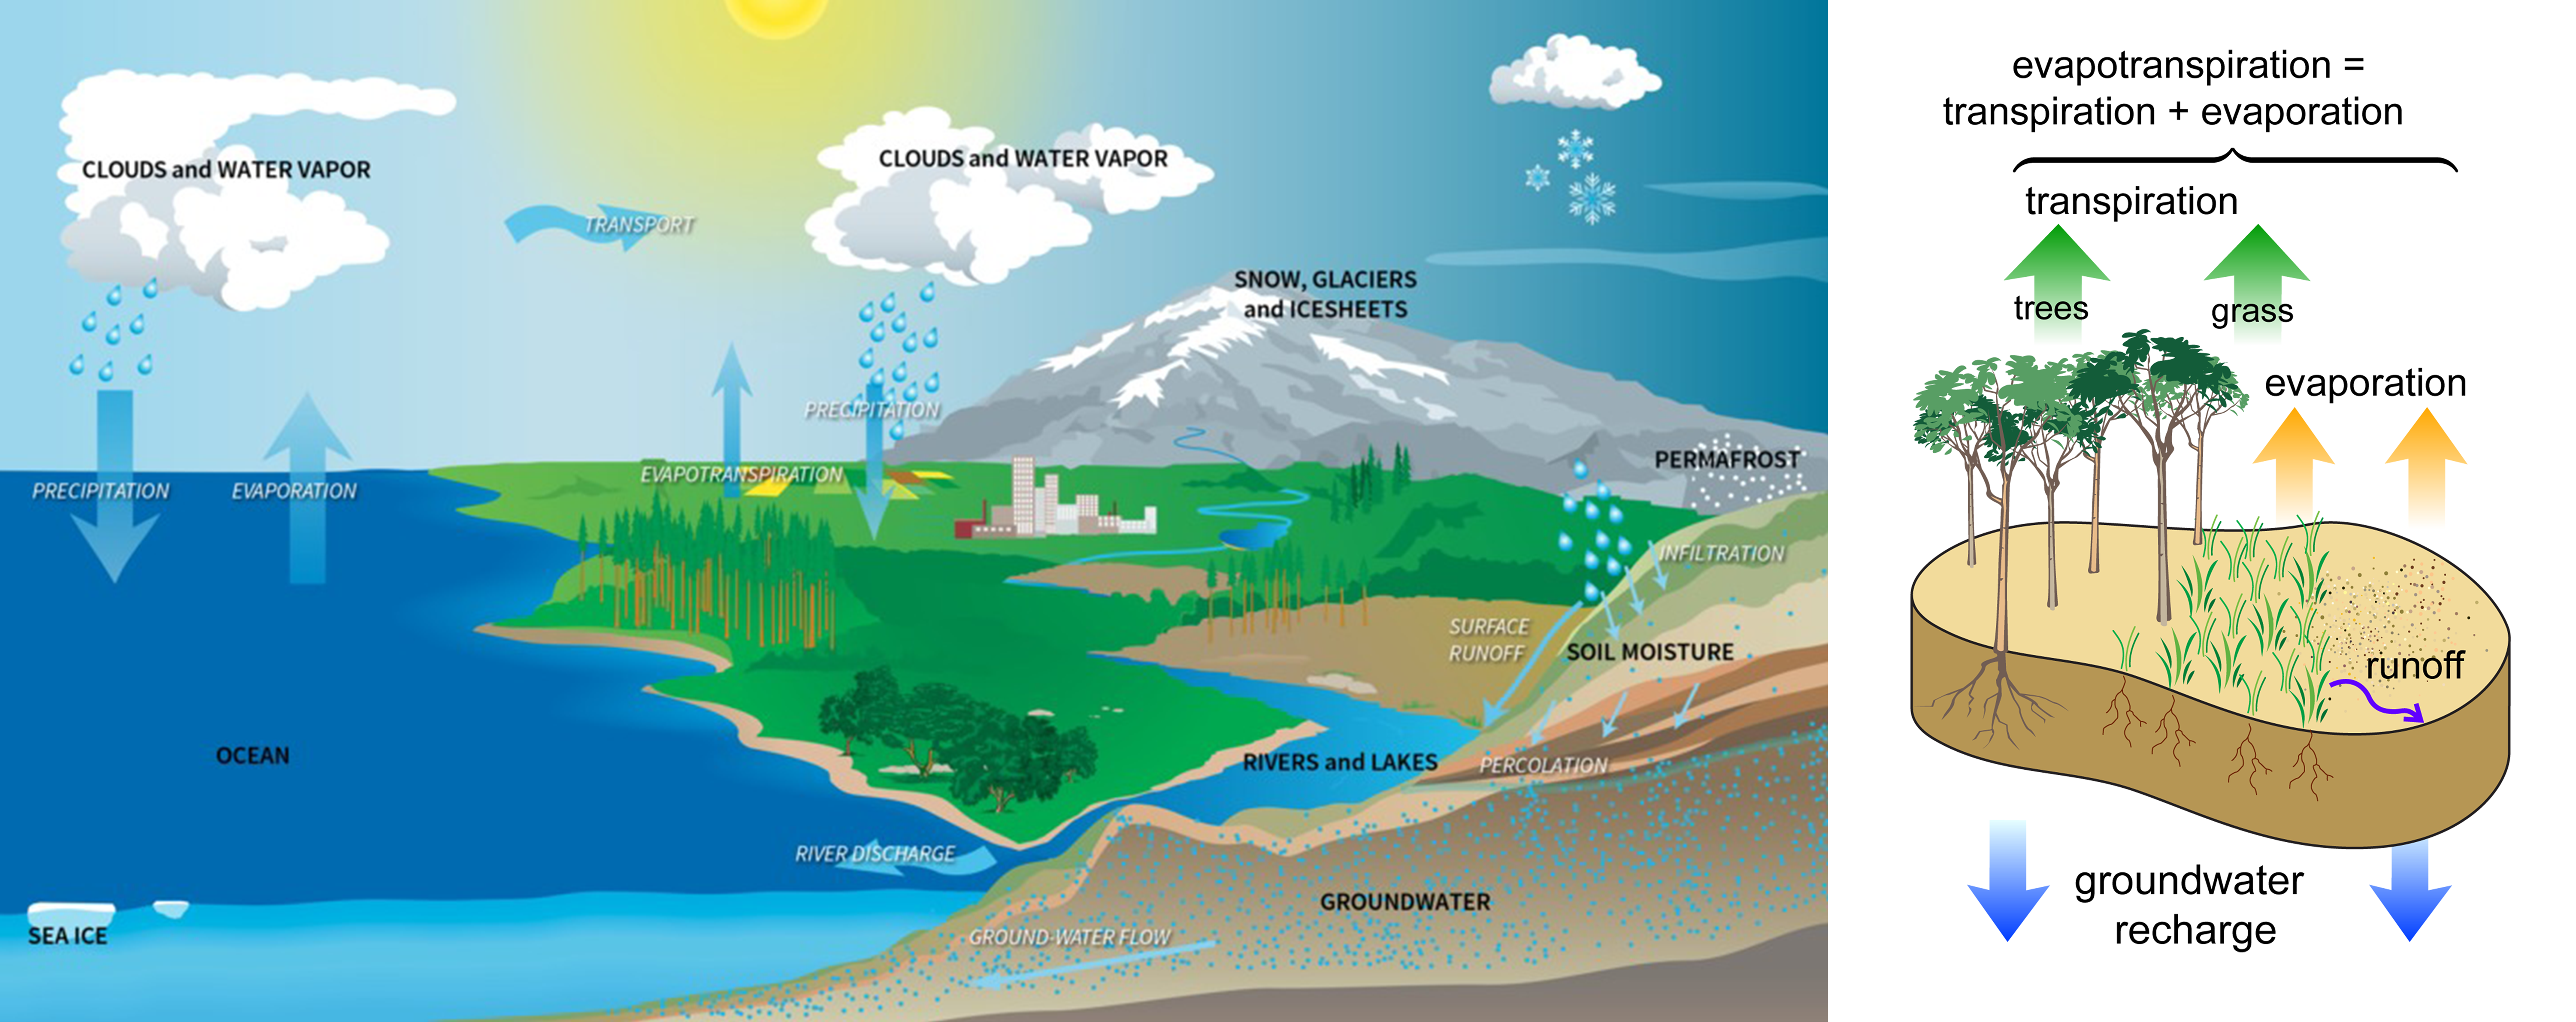
Above left: A conceptual diagram of the water cycle, showing how water evaporates from the Earth’s surface, rises into the atmosphere, cools, condenses to form clouds, and falls again to the surface as precipitation. About 75% of the energy (or heat) in the global atmosphere is transferred through the evaporation of water from the Earth’s surface. On land, water evaporates from the ground, mainly from soils, plants (i.e., transpiration), lakes, and streams. In fact, approximately 15% of the water entering the atmosphere is from evaporation from Earth’s land surfaces and evapotranspiration from plants. Such evaporation cools the Earth’s surface, cools the lower atmosphere, and provides water to the atmosphere to form clouds. Credit: NASA’s Scientific Visualization Studio. Above right: A conceptual diagram of near-surface hydrology, showing groundwater recharge, runoff, evaporation, transpiration, and evapotranspiration processes. Diagram by M.W. Toews, CC BY 4.0, via Wikimedia Commons, unedited.
Detecting flash droughts as early as possible is critical so that stakeholders including farmers and emergency managers have as much time as possible to plan for the impacts of droughts to agricultural and energy production, water availability, wildlife, and human health and anticipate the likelihood of wildfires. The typical pattern of flash droughts is shown in the timeline below.
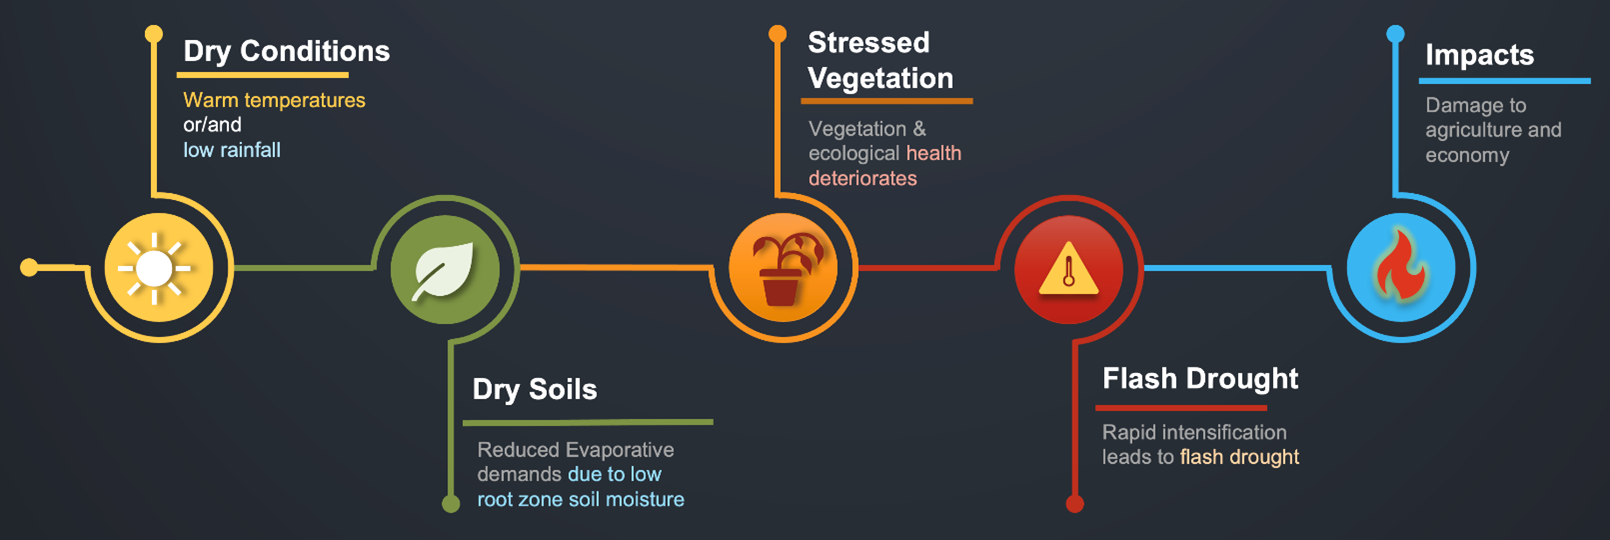
A conceptual timeline of a flash drought showing the typical sequence of events, along with their respective characteristics and impacts. Diagram by Shahryar Ahmad, NASA Goddard.
NASA’s EIS project is designed to provide collaborative environments in which a diversity of data can be brought together to better understand Earth’s fires, freshwater, sea level, carbon, and other aspects. The flash drought research that Shahryar et al. conducted leveraged the EIS pilot study. When researchers can bring both observational and model data together into one platform, they can more quickly derive an understanding of Earth systems.
The focus of NASA Goddard’s Hydrological Sciences Laboratory is to develop remote sensing and modeling techniques that improve the understanding of how various components of the hydrological cycle interact over a broad range of spatial and temporal scales, thus producing important information about the current structure of global hydrology and how humanity is changing Earth’s hydrological environment.
Dr. Shahryar Ahmad, a Hydrological Sciences Laboratory research scientist, studies the Earth’s water resources, how they are changing, and the impacts of the human footprint on these resources. Understanding the availability of water and its movement through the Earth ecosystem is the key to the sustainable management of this natural resource.
Ahmad’s current research focuses on enhancing our understanding of the evolution and mechanism of hydrologic extremes, such as droughts. He uses hydrological models (combined mathematical equations coupled with data) to study Earth processes that govern the water cycle and its components such as rainfall, evapotranspiration, soil moisture retention, and vegetation condition. Extreme or sudden variation in one or more of these components lead to extreme events such as droughts.
Leveraging the EIS cloud computing platform built by NASA’s SMCE team, Ahmad and his colleagues recently completed a study of flash droughts in the northern Great Plains and published the results in a peer-reviewed science journal. (See “Related Links.”) The research revealed substantial changes in evaporative stress in the study area in spring 2017 after only one month, evidence of a flash drought.
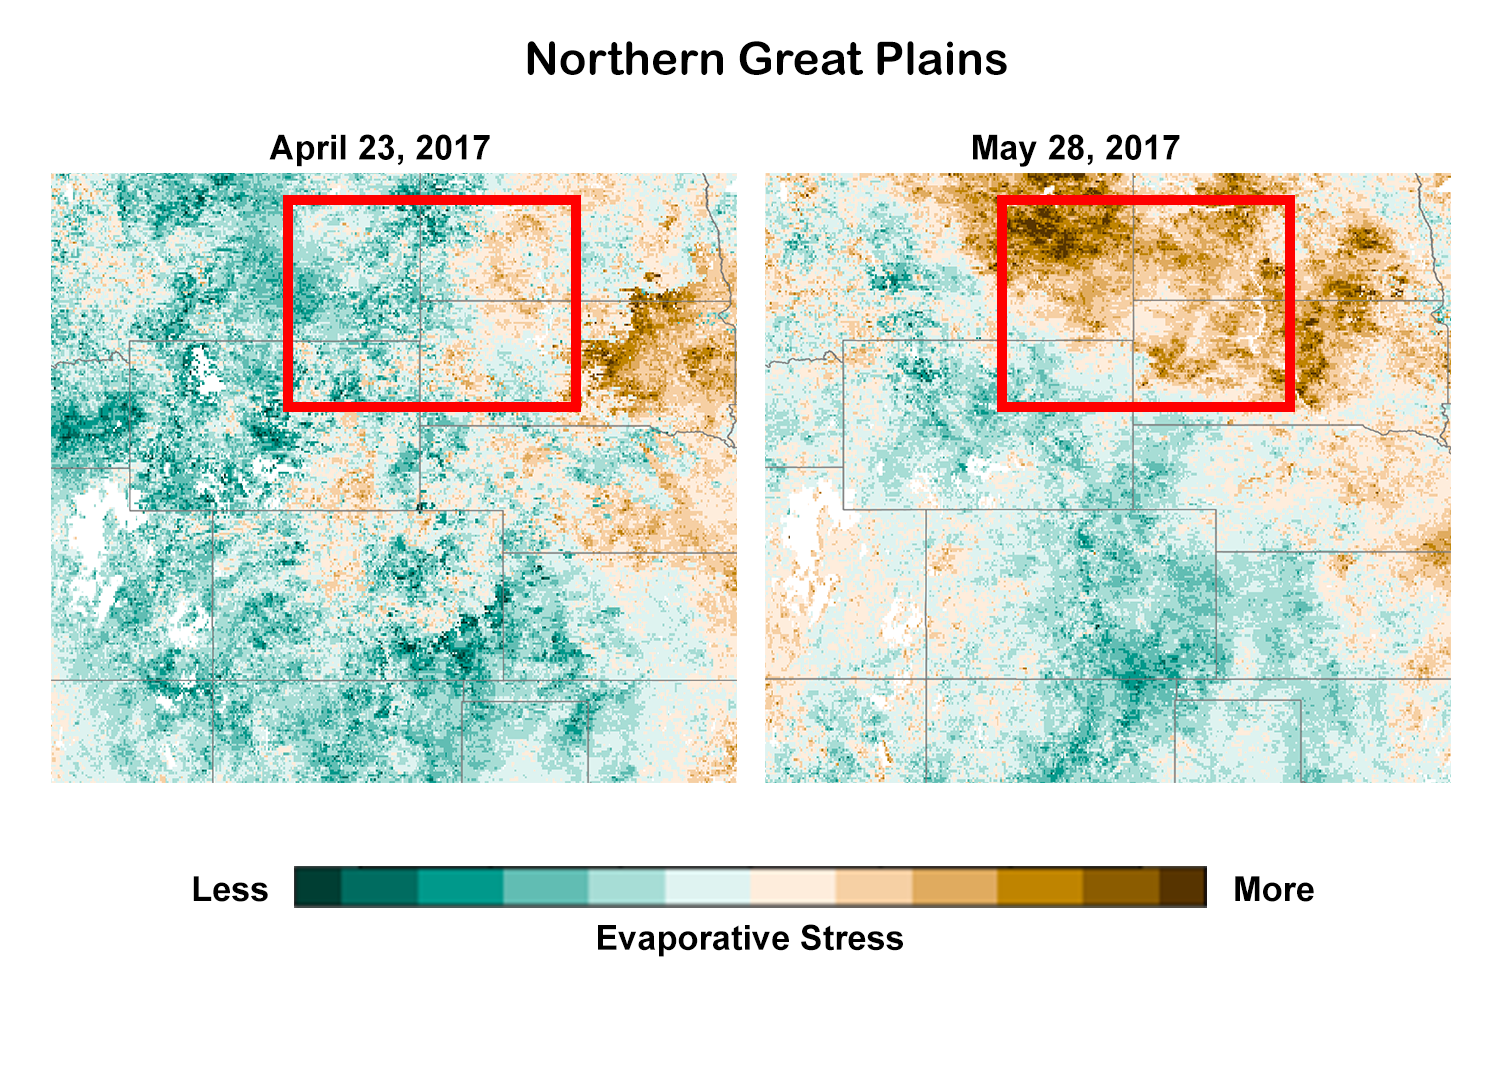
The two maps illustrate the rapid onset of changes in evaporative stress within the selected study area of the northern Great Plains of the United States between April 23, 2017 (left) and May 28, 2017 (right). Clockwise from top left in the study area shown is the four corners region of Montana, North Dakota, South Dakota, and Wyoming. Maps courtesy of Shahryar Ahmad, NASA Goddard.
The study demonstrates that leaf area index observations, when integrated within a land surface model, are effective in capturing high transpiration at the onset of 2016 drought driven by intense heat waves. The 2017 flash drought, however, was initiated by a precipitation deficit where information on soil moisture is necessary to capture the rapid drying of soils. The modeled outputs not only capture the rapid drying of soil at the onset of droughts but are also spatially and temporally consistent with Evaporative Stress Index data and U.S. Drought Monitor maps. The study highlights the role of multi-variable assimilation of remotely sensed vegetation and soil moisture information to capture the rapid rates of onset and contrasting pathways of flash drought development.
The animation shows the onset of flash drought that occurred during the 2017 rainy season from May-July. The Northern Great Plains experienced unusually low precipitation that season, as captured by GPM-IMERG (red values denote lower than normal precipitation). Visualization by Shahryar Ahmad, NASA Goddard.
Through an extensive co-design process, the SMCE team delivered a robust platform for EIS that utilizes Jupyter notebooks, Dask for parallel processing, and traditional high-performance computing in a single, low-cost, cloud-based environment.
As Shahryar et al. demonstrated in conducting flash drought research, analyzing numerical models, satellite observations, and other resources in one cloud computing platform, the open-source EIS enables internal and external stakeholders to work collaboratively and more quickly derive an understanding of Earth systems.
Cloud computing is a concept that refers to compute, storage, and network infrastructure assembled as a platform on which applications and systems can be deployed quickly and scaled up or down as needed by users on the fly. It is a self-service system in which users can select their needed resources from a dashboard and quickly run applications in the assembled environment.
Over the past decade or more, commercial cloud computing has matured considerably, becoming a viable platform for scientific computing at NASA and beyond. To take advantage of this rapidly growing capability, the Computational and Information Sciences and Technology Office (CISTO) at NASA Goddard developed the Science Managed Cloud Environment (SMCE) in spring 2020.
The SMCE provides researchers with cloud-native compute and storage solutions specifically engineered for science. Its familiar and intuitive environment enables researchers to quickly become productive without having to become cloud experts.
NASA’s EIS is a use-specific, SMCE-built platform for understanding and answering critical questions about Earth’s complex System of Systems. Using NASA’s 20+ years of Earth observation data and novel modeling capabilities, it aims to support near-term and long-range analysis and decision making in support of preparation, mitigation, and resilience in the face of climate change.
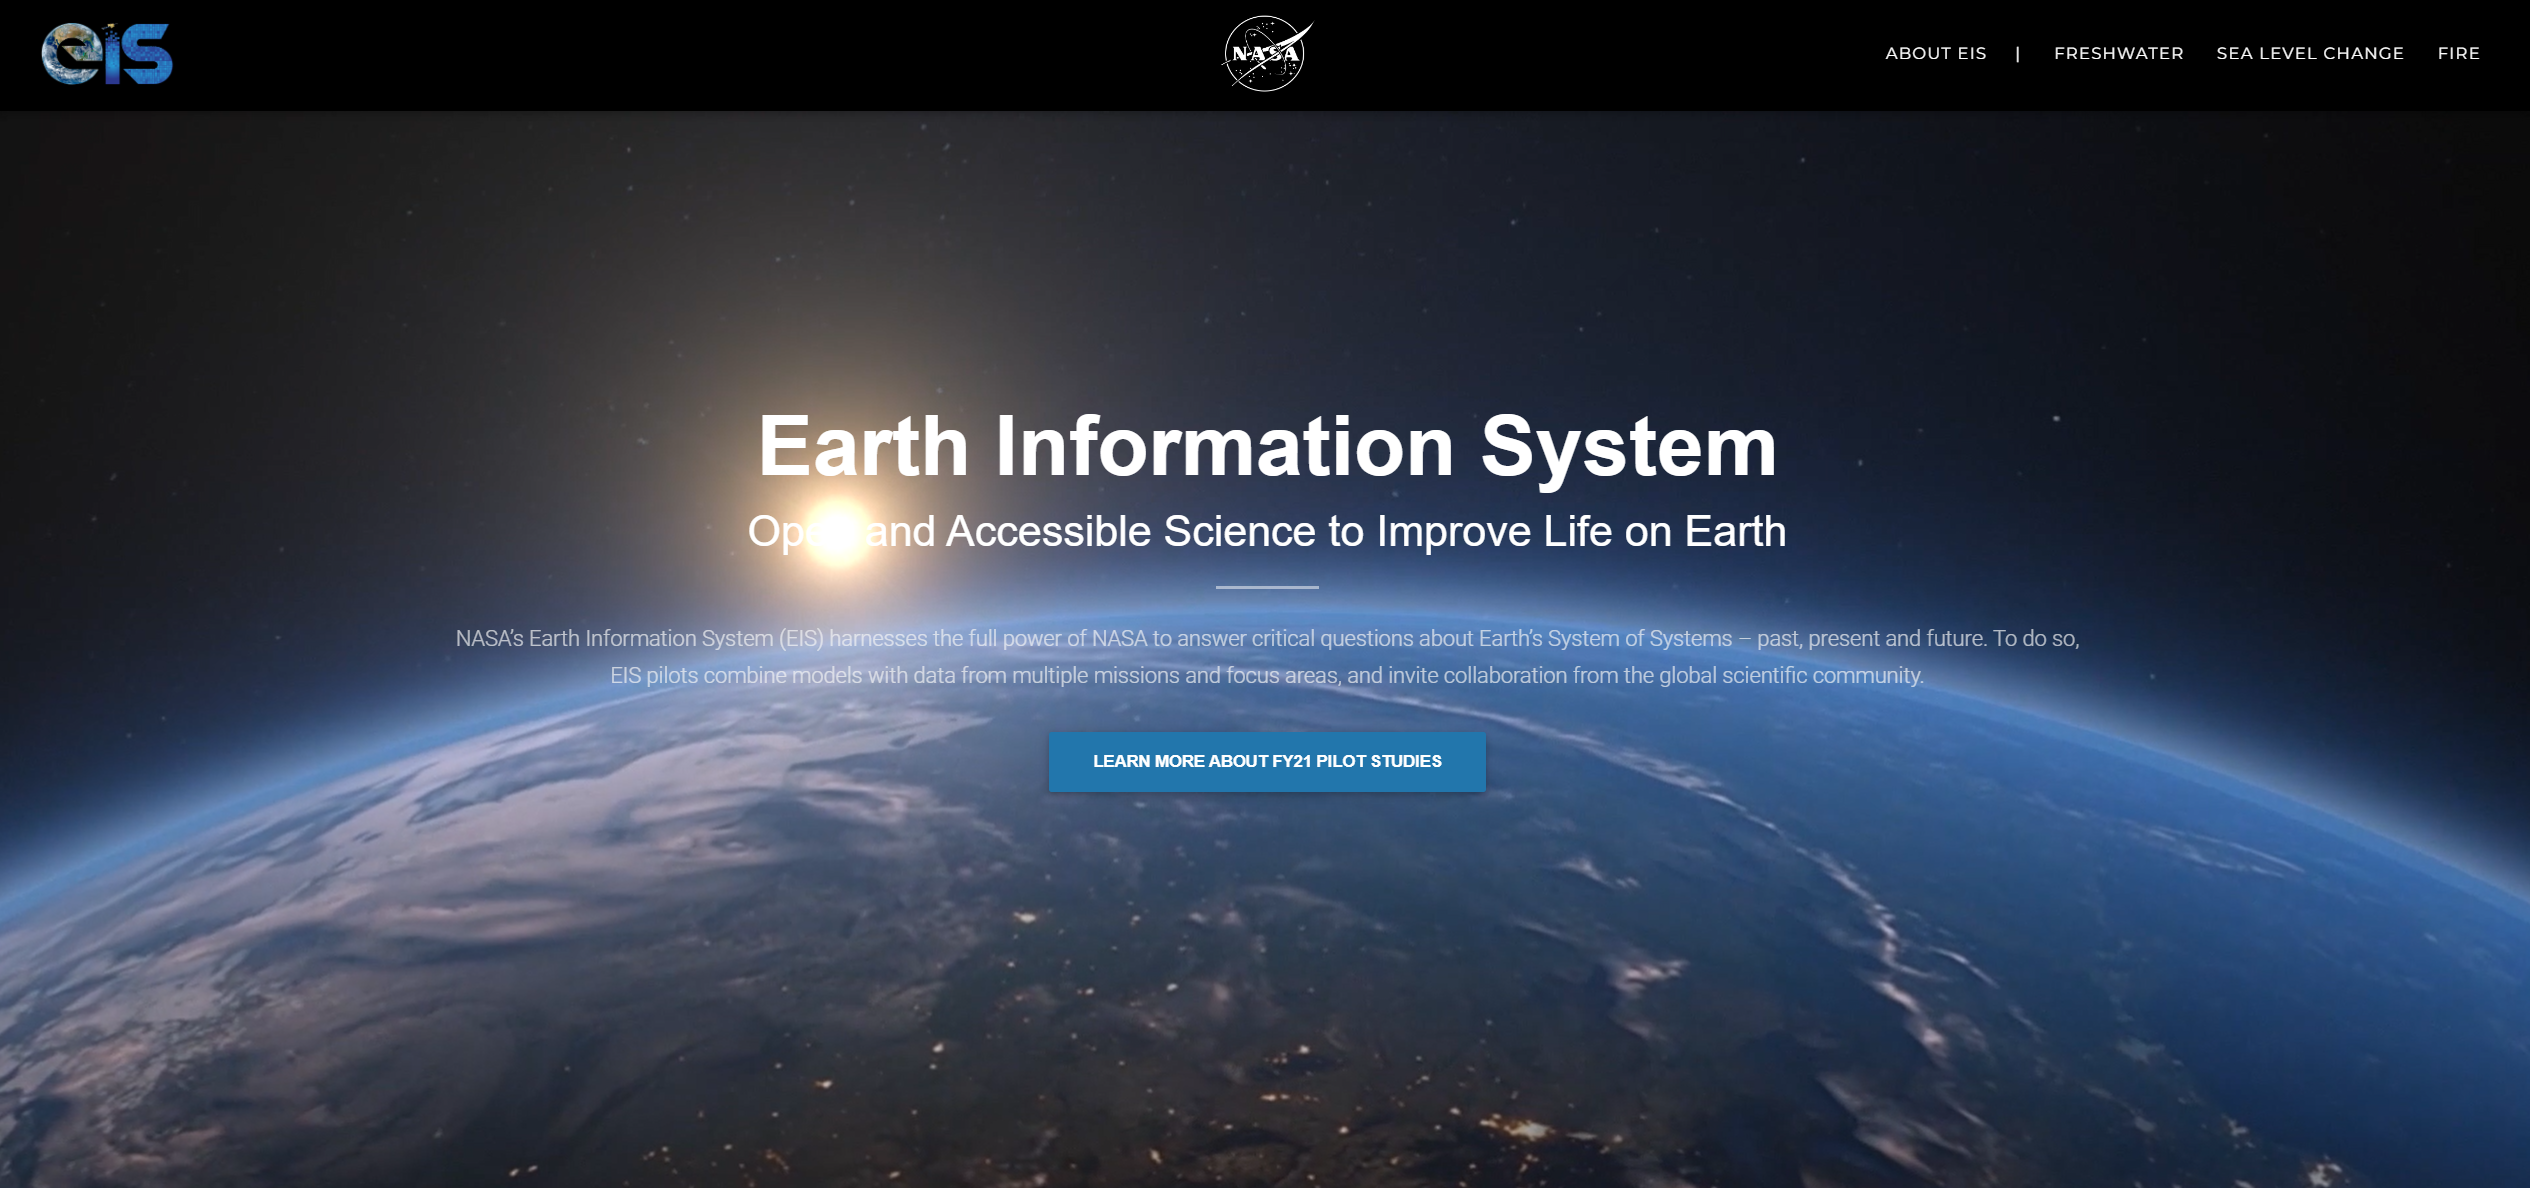
A screen shot of the homepage and dashboard of the NASA Earth Information System, a pilot project supported by the SMCE. Image credit: NASA.
The EIS builds upon NASA’s Earth Observing System Data Information System (EOSDIS), and leverages NASA’s Earth Science Data System’s (ESDS) Data System Evolution (DSE) and the cloud-based computational resources of NASA’s HEC Program. Combining models with data from multiple missions and focus areas, NASA scientists develop Level 5 (L5) Science Products. L5 Products range from reanalysis to real-time integrated products to skillful predictions. For example, fire risk is dependent on fuels that are studied in several focus areas (precipitation, soil moisture, vegetation health and structure); in turn, active fires generate atmospheric conditions that travel the globe and impact air quality. The EIS answers questions related to the global interaction of multiple focus areas and does so in a way that is comprehensible and relevant on a local level.
"NASA’s Science-Managed Cloud Environment has been instrumental in providing the necessary compute resources to enable modeling, analysis, and visualization capabilities for this flash drought research,” said study leader Shahryar Ahmad.
“Collaboration environments enabled through SMCE have been critical in sharing and communicating the science to the broader science community,” emphasized flash drought study coauthor and NASA senior physical scientist Sujay Kumar. ”The EIS study led by Shahryar provides a powerful demonstration of the importance of NASA remote sensing datasets for accurate characterization and monitoring of socially relevant applications such as droughts.”
Shahryar Ahmad attended K-12 at the historic Aligarh Muslim University (AMU) in Aligarh, India, founded in 1875 by Sir Syed Ahmad Khan, a highly educated nobleman, philosopher, scientist, and knight in the Order of the Star of India. The college was designed by Sir Syed Ahmad Khan to model the physical and educational systems of Cambridge and Oxford Universities and combines elements of architectural design from both eastern and western traditions.
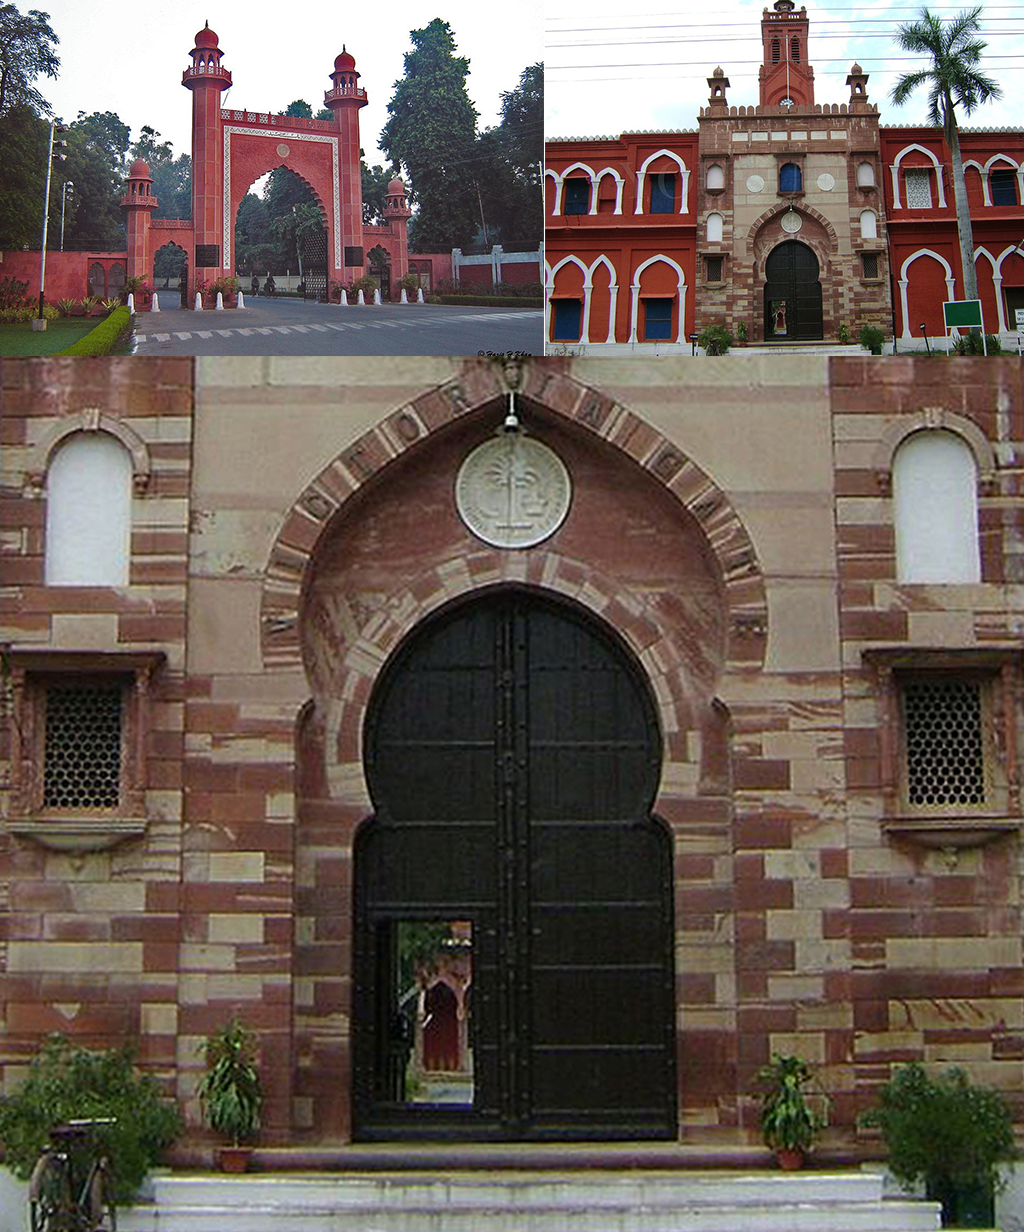
Top left: The massive, keyhole-arched, red sandstone gate and main entrance to the historic Aligarh Muslim University (AMU) in Aligarh, India supports several minarets with finial-topped domes and features several smaller arched gates of different scales. Photograph by Haris H. Khan, CC BY-SA 3.0, via Wikimedia Commons. Top right: The Victoria Gate at AMU, with its bell tower and historic clock perch above the entry door at the center of the building’s hooded-window façade. Bottom: A closeup of the Victoria Gate’s massive, arched front door. Photograph by Yousufnet, CC BY-SA 3.0, via Wikimedia Commons.
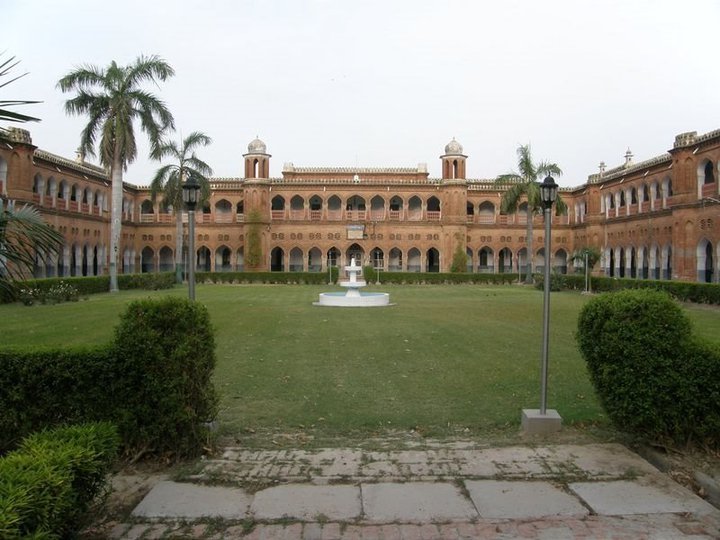
Above: The AMU secondary school (high school) quadrangle, surrounded on three sides by two-stories of keyhole-arched arcades. Photo by Adilmasood, CC BY-SA 4.0, via Wikimedia Commons.
Shahryar Ahmad attended AMU as a day student from primary through secondary school. In high school, he moved into the campus dormitories, where he lived and studied. In summers and on holidays, he often returned from Aligarh to the village where he was born, Tanda, and where his father and grandfather’s generation grew up.
Tanda has long been an industrial city famous for its hand weaving. In the 1960s, that tradition changed from using hand looms to using mechanical looms (power looms) to weave textiles. Power looms are installed inside homes, and the textiles are made and sold as a family business.
Ahmad’s grandfather also owned power looms. These looms are like giant robots, with many moving and interacting parts: wheels, gears, cogs, hinges, and threaded looms. Most of the families in the ancestral town of the Ahmad family left school at age 10 to 15 to work in the power loom industry, almost by default. In a strategic break from that tradition, Ahmad’s father travelled to Aligarh to study at AMU, fulfilling his grandfather’s dreams, where he specialized in Geology.
Above: A video of some of the complex power looms at work in Tanda, the town where Ahmad’s father and grandfather’s generations grew up. Video by Shahryar Ahmad.
In school, Ahmad was excited by models of rockets and satellites shown at the school’s science exhibits. What really sparked his imagination were two planetary science missions launched in 2008 and 2013, respectively, by the Indian Space Research Organisation (ISRO): Chandrayaan-1, the first Indian lunar probe, and Mangalyaan-1, the Mars Orbiter Mission
This early exposure to space science led to a keen interest in robotics, which led him to study engineering. In his freshman year of college at the Indian Institute of Technology (IIT) in Kanpur, Ahmad became deeply involved in robotics. He joined the college robotics club and stayed on campus throughout that summer to participate in the robotics immersion program and robotics competitions.
In his sophomore and junior years of college, Ahmad completed internships in remote sensing and geographic information systems (GIS). Further along in his undergraduate years, he learned more about global positioning system (GPS) satellites, in particular ISRO’s Indian Regional Navigation Satellite System (IRNSS), along with other US and European satellites. These experiences and his growing knowledge inspired Ahmad's transition to geoinformatics and Earth sciences.
Through one of his civil engineering professors at IIT, Bharat Lohani, who is also a pioneer in commercial uses of Light Detection and Ranging (Lidar), Ahmad learned about the civil engineering program at the University of Washington (UW) in Seattle. After completing his undergraduate degree at IIT, Ahmad made a giant leap from the state of Uttar Pradesh, bordered by the Himalayas, to the state of Washington, bordered by the Cascade Range and Olympic Mountains to join Faisal Hossain’s Satellites, Sustainability, and Water (SASWE) group at UW. Ahmad lived in Seattle for five years, researching the use of weather forecasts for improving dam operations.
During his graduate studies at UW, Ahmad interned with Dr. Sujay Kumar and the Land Information System (LIS) team at NASA Goddard, his first hands-on exposure to research at NASA laboratories. He also became involved in the NASA-supported Lake Observations by Citizen Scientists & Satellites (LOCSS) Citizen Science project, analyzing citizen science data on lake heights to estimate changes in lake volume, a changing feature of lakes that are critical to the ecosystem.
After completing his Ph.D. in civil engineering at UW, Ahmad’s next leap involved moving from Washington to Maryland to work at NASA Goddard’s Hydrological Sciences Lab as a post-doc researcher. At NASA Goddard, working with Sujay Kumar, he became deeply involved in the NASA EIS pilot study that leveraged a cloud computing platform developed by the NASA High End Computing Program’s SMCE team.
Learn more about Ahmad’s college career and inspiration in this NASA Early Career Scientist Spotlight.
Related Links
- Ahmad, S.K., S.V. Kumar, T.M. Lahmers, S. Wang, P.-W. Liu, M.L. Wrzesien, et al., 2022: Flash Drought Onset and Development Mechanisms Captured with Soil Moisture and Vegetation Data Assimilation. Water Resources Research, 58, doi:10.1029/2022WR032894.
- Ahmad, S.K., 2021: “Propagation and Impacts of Great Plains Drought captured by NASA Models and Datasets” – EIS StoryMap.
- U.S. National Weather Service Climate Prediction Center: Flash Drought Monitoring.
- USGS: New Warning System Identifies Flash Drought Quickly.
Sean Keefe, NASA Goddard Space Flight Center
February 28, 2023