NCCS-Enabled Data Assimilation Probes Impact of
Pacific Ocean Heatwaves on Phytoplankton Populations
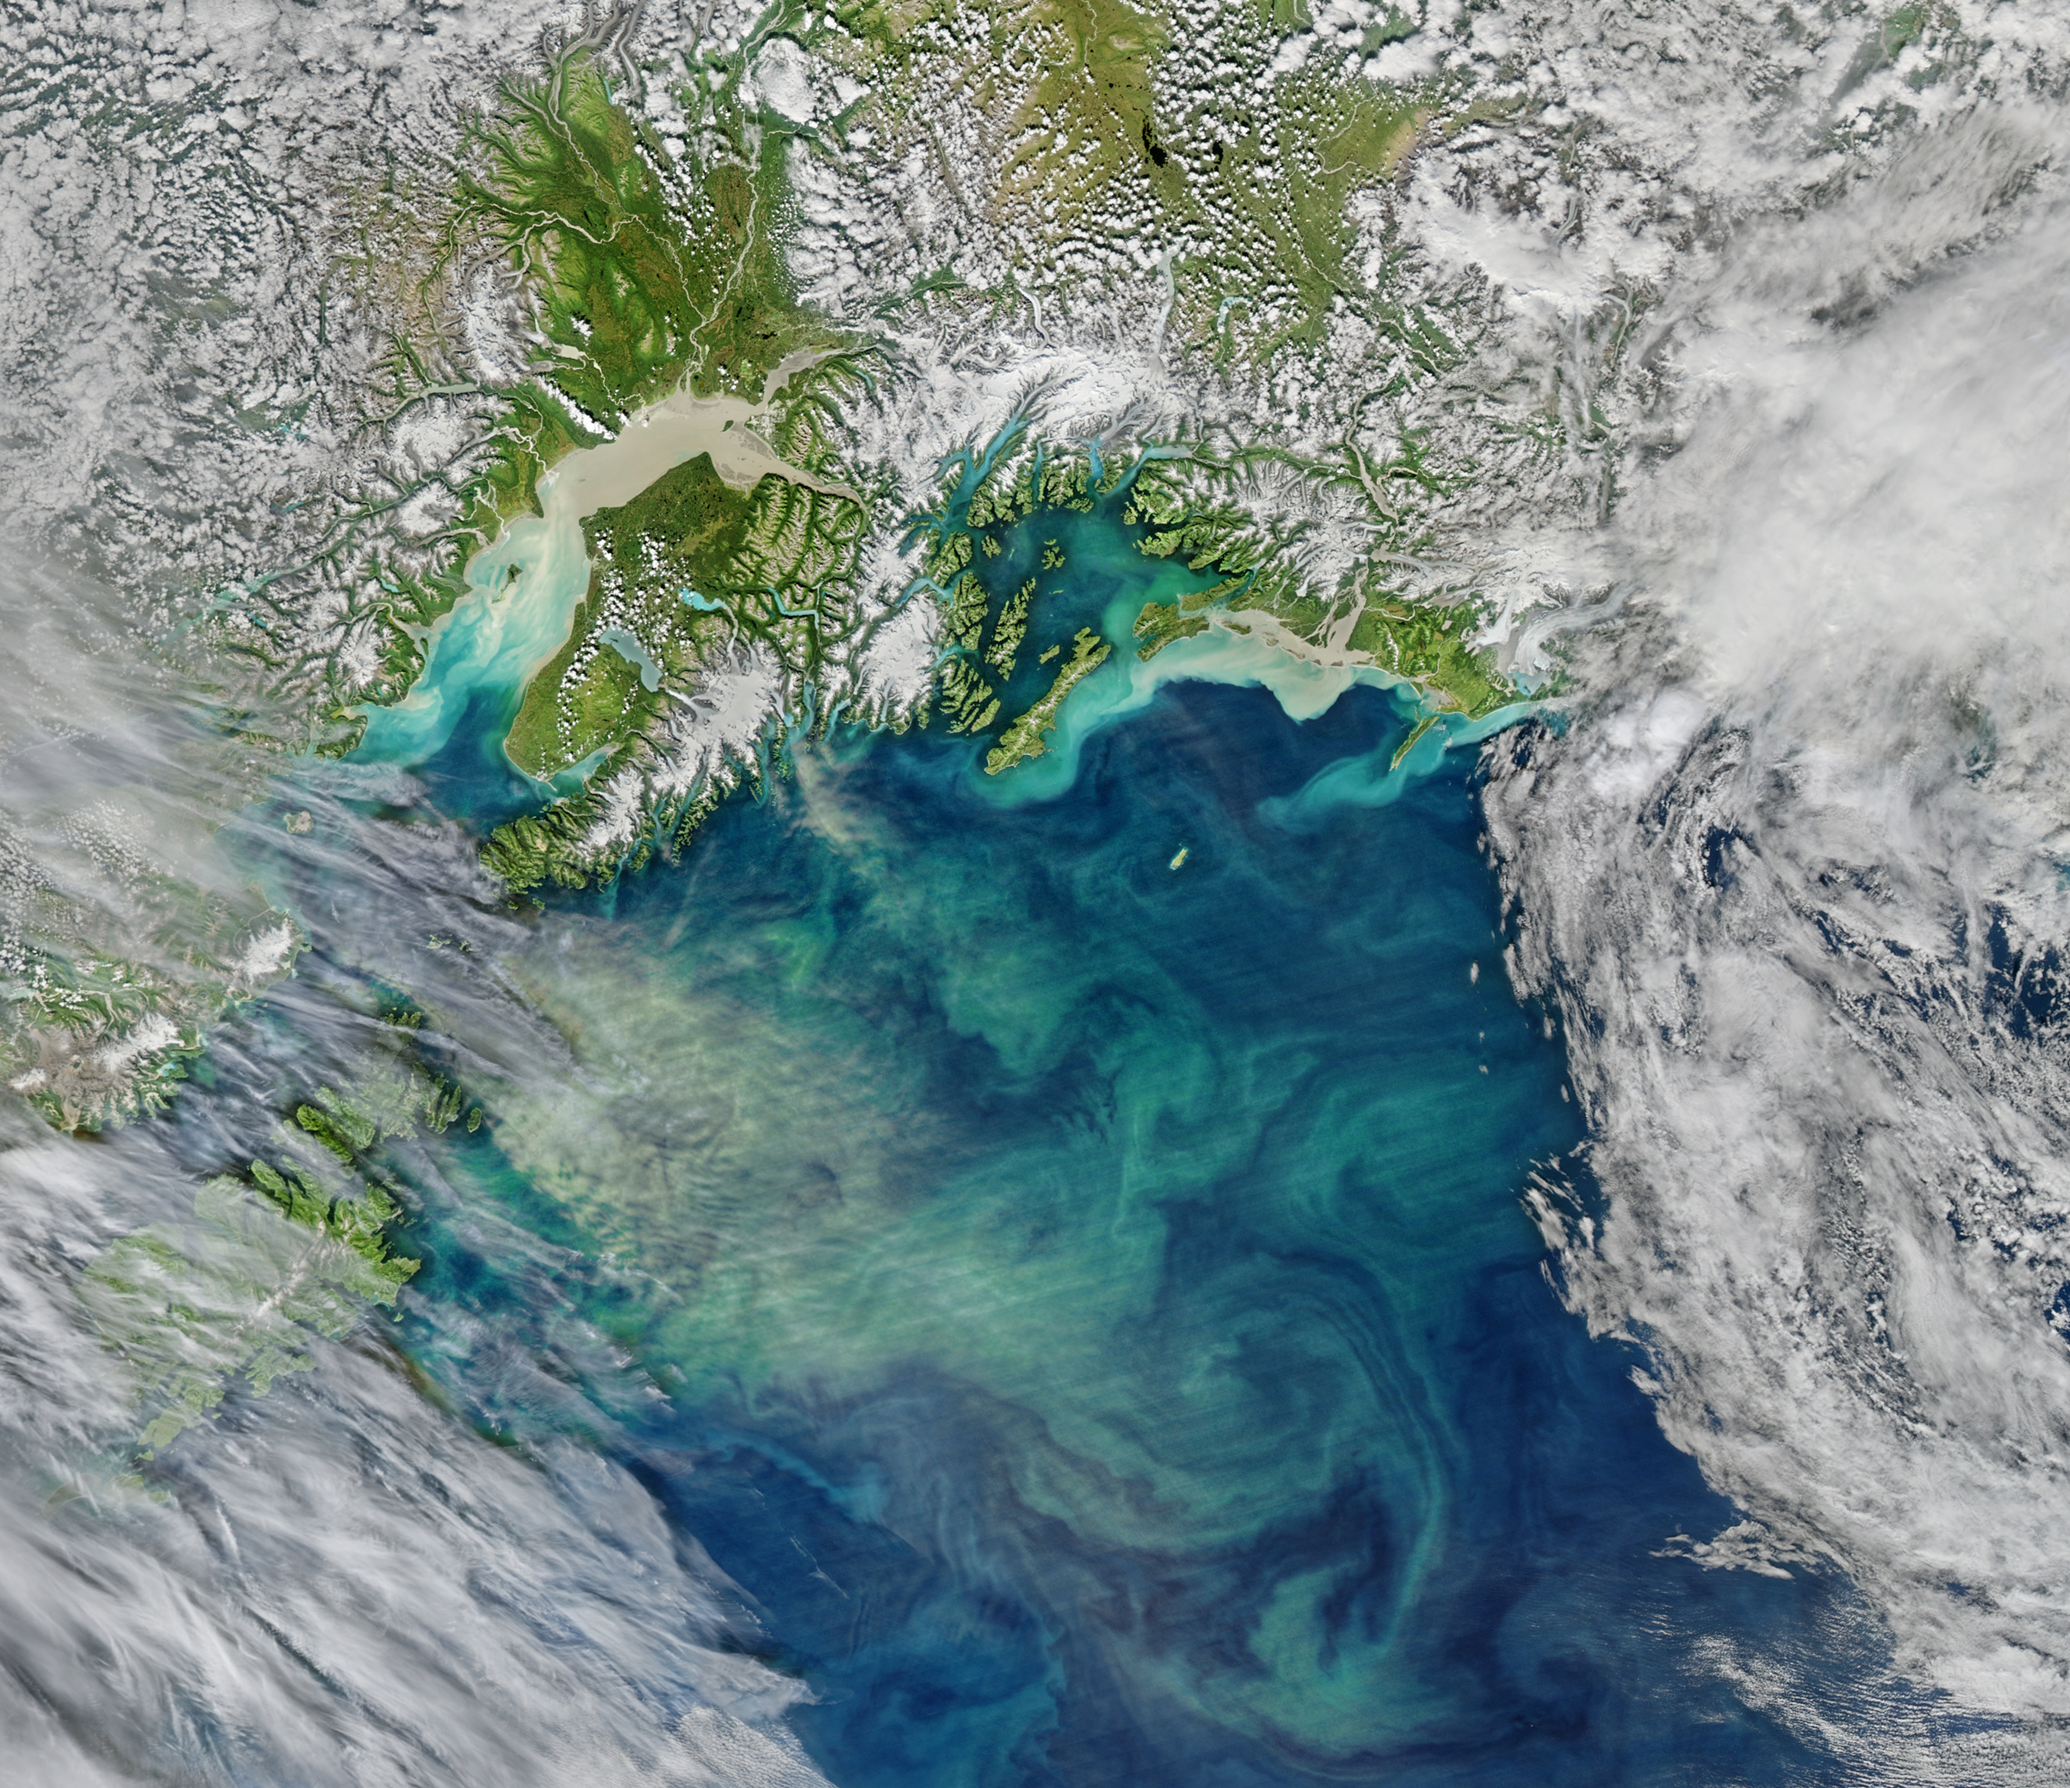
Suspended sediment and late summer phytoplankton blooms color the Gulf of Alaska in this composite of MODIS and VIIRS satellite instrument data collected on August 28, 2018. By combining ocean data and modeling, NASA Goddard Space Flight Center scientists studied how heatwaves affected phytoplankton in the Gulf of Alaska and other regions of the Pacific Ocean. Image by NASA's Ocean Biology Processing Group. See more images in the Ocean Color Image Gallery.
One of Earth’s tiniest creatures is also one of its most impactful. While phytoplankton may be individually microscopic, due to their abundance in both salty and fresh surface waters, they play several outsized roles.
Phytoplankton are the first level of the marine food chain, serving as nutrients for small fish and invertebrates such as shrimp and snails. Drop-offs in phytoplankton populations ultimately mean fewer larger fish for humans up the chain to grow, catch, and eat. Phytoplankton also account for about half of Earth’s annual global biological productivity. All over the world they turn sunlight and carbon dioxide into organic matter, including through photosynthesis like plants do on land.
In a first-of-its-kind study, NASA Goddard Space Flight Center scientists used the NASA Center for Climate Simulation (NCCS) Discover supercomputer to combine ocean data and modeling to assess how recent heatwave events affected phytoplankton populations in the open Pacific Ocean.
Ivona Cetinić, the Science Lead for Ocean Biogeochemistry for NASA’s Plankton, Aerosol, Cloud, ocean Ecosystem (PACE) mission describes the weird, wonderful, and important world of phytoplankton and why it's important for PACE to study these tiny creatures. PACE is scheduled to launch in January 2024. Video by NASA Goddard Space Flight Center, with visualizations by Ryan Fitzgibbons and Greg Shirah, writing and editing by Ryan Fitzgibbons, and scientific consulting by Ivona Cetinić and Jeremy Werdell. See full credits.
Because phytoplankton contain chlorophyll, scientists can estimate their populations from space. Phytoplankton absorb red and blue light and reflect green light. Thus, regions with high phytoplankton concentrations tend to appear as blue-green to green, while regions with low phytoplankton concentrations tend to appear as blue.
Over the last few decades, ocean color science has leveraged satellite instruments including the Sea-viewing Wide Field-of-view Sensor (SeaWiFS), the Moderate Resolution Imaging Spectroradiometer (MODIS), and the Visible Infrared Imaging Radiometer Suite (VIIRS). NASA’s newest ocean color satellite — Plankton, Aerosol, Cloud, ocean Ecosystem (PACE) — is scheduled to launch in January 2024. Besides chlorophyll, satellites can estimate dissolved organic matter and particulate inorganic carbon.
More than 20 years of ocean color satellite data drove the heatwave study carried out at NCCS by NASA Goddard scientists Lionel Arteaga and Cecile Rousseaux. The study was published earlier this year in the journal Communications Biology.
“Marine heatwaves have become, and will likely now be, more recurrent in the decades to come,” said Arteaga, an Earth Scientist in NASA Goddard’s Global Modeling and Assimilation Office (GMAO) and the University of Maryland, Baltimore County’s Goddard Earth Sciences, Technology and Research II (GESTAR II). “Understanding their impacts is critical to strategic rather than reactive resource management.”
The most recent Pacific Ocean heatwaves started in 2013 when a big heatwave nicknamed “the Blob” developed in the Gulf of Alaska. The Blob resulted in considerable ecological consequences, including declines in the populations of whales, sea lions, and other marine mammals in the coastal and open ocean, as well as massive death of seabirds. “Up to now, no studies had assessed the impacts of these heatwave events on phytoplankton groups in the open ocean,” Arteaga explained. “This was a critical missing piece to our understanding of these events since phytoplankton represent the first level of the food chain.”

Study authors were Lionel Arteaga and Cecile Rousseaux of NASA Goddard Space Flight Center. Photos courtesy of Jay Friedlander, NASA Goddard Space Flight Center.
For their study, scientists Arteaga and Rousseaux assimilated satellite data from two NASA satellite instruments — SeaWiFS and Aqua/MODIS — into the NASA Ocean Biogeochemical Model (NOBM). “The NOBM is a simplified mathematical representation of upper ocean biogeochemical dynamics,” said Rousseaux, a Senior Scientist in NASA Goddard’s Ocean Ecology Laboratory. “Some of the main output variables from the model, such as chlorophyll, are confronted against satellite observations to obtain an improved estimate over that from the model or satellite data alone.”
After a 200-year spin-up run on the NCCS Discover supercomputer, the NOBM ran from 1979–1997 using the GMAO’s MERRA-2 reanalysis product and then assimilated the SeaWiFS (1998–2002) and Aqua/MODIS (2002–2020) satellite data on a daily basis through the end of 2020. The spin-up took about one month of computing time, while the 1979–2020 run completed in roughly a week. “Without the NCCS supercomputing facilities, this work would just not be possible,” Rousseaux said.
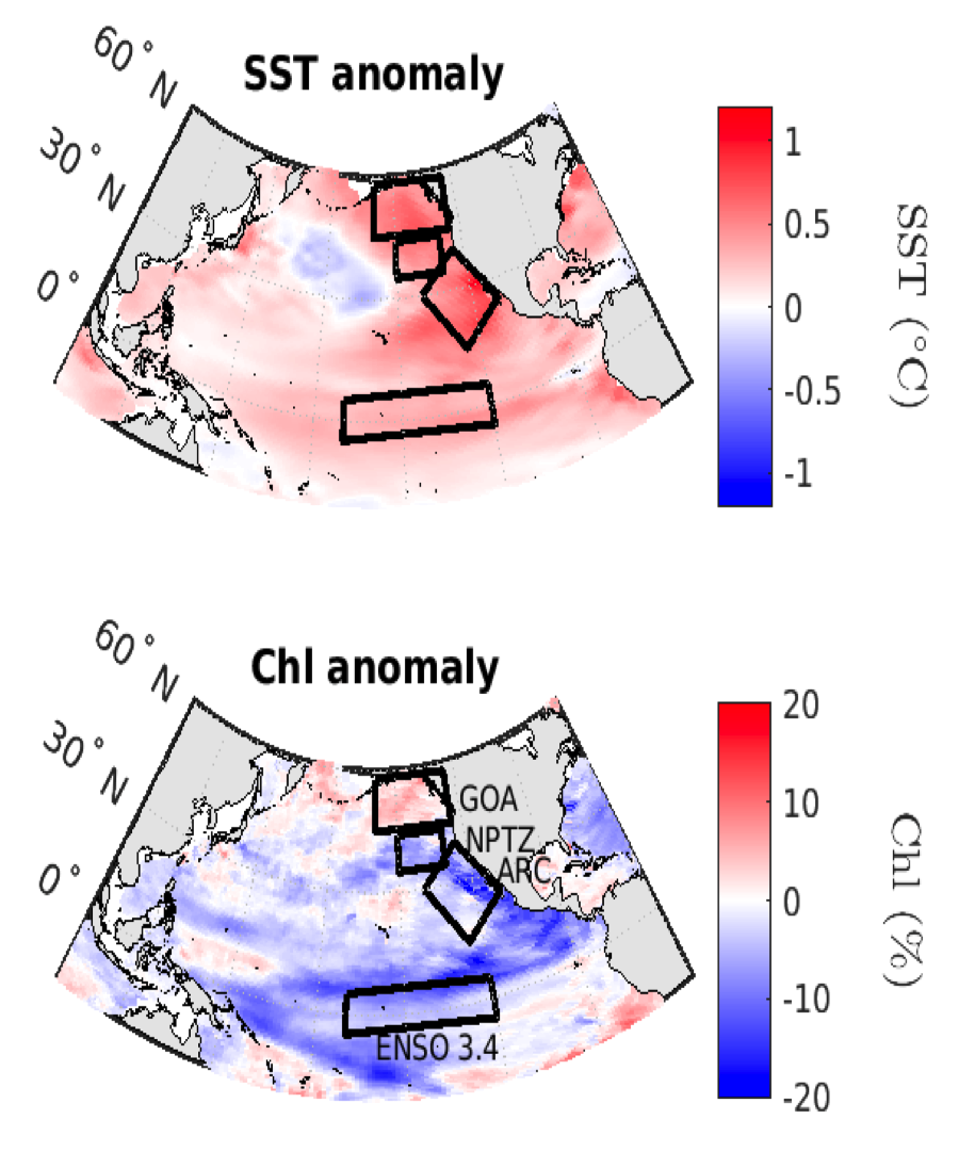
Mean modeled Pacific Ocean sea surface temperature (SST) and surface chlorophyll (Chl) anomaly over the anomalously warm period between March 2013 and December 2020, inferred by the NASA Ocean Biogeochemical Model. Figure adapted from Arteaga and Rousseaux, 2023.
The main model outputs of interest are the biogeochemical variables of chlorophyll; nutrients (nitrate, silicate, iron); light; and phytoplankton groups. “These variables are the best diagnostic to understand the changes in physical circulation and chemical water composition affecting phytoplankton growth,” Rousseaux said.
Impact: Results from combining NASA biogeochemical modeling and satellite imagery can help guide the monitoring of oceanic ecosystems and carbon fluxes in the presence of more recurring extreme heatwaves driven by changes in global climate.
Arteaga and Rousseaux‘s study focused on four regions of the Pacific Ocean:
| Region | Heatwave Dates | Notable Features |
|---|---|---|
| GOA: Gulf of Alaska | 2013–2014 | The starting point of the last decade’s Pacific heatwaves, called “the Blob.” |
| ARC: North American Pacific coast |
2015 | Warm anomalies expanding from the GOA further to the east and extending along the entire coast. GOA and ARC showed the strongest warm anomalies in the North Pacific. |
| NPTZ: North Pacific Transition Zone |
2014 | Extremely low surface chlorophyll levels, also associated with the Blob. |
| ENSO 3.4: El Niño-Southern Oscillation/Equatorial Pacific | 2016 | Extremely warm temperature anomalies during the 2016 El Niño, one of the strongest on record. |
Note: See the previous figure under Chl anomaly for the locations of these regions.
The primary study finding was in the equatorial Pacific (ENSO-affected region), where a reduction in nitrate supply caused by the 2016 El Niño severely diminished the concentration of one key phytoplankton group (diatoms). Chlorophyll levels also dramatically dropped by 40%.
In contrast, the 2013–2014 Gulf of Alaska (GOA) heatwave triggered an initial and surprising rise in chlorophyll concentration driven by an increase in smaller phytoplankton (dinoflagellates) that overtook the ecological niche left by an earlier reduction in diatoms. The GOA diatoms decreased due to a reduction in the supply of silicate, caused by the anomalous wind patterns that triggered the Blob.
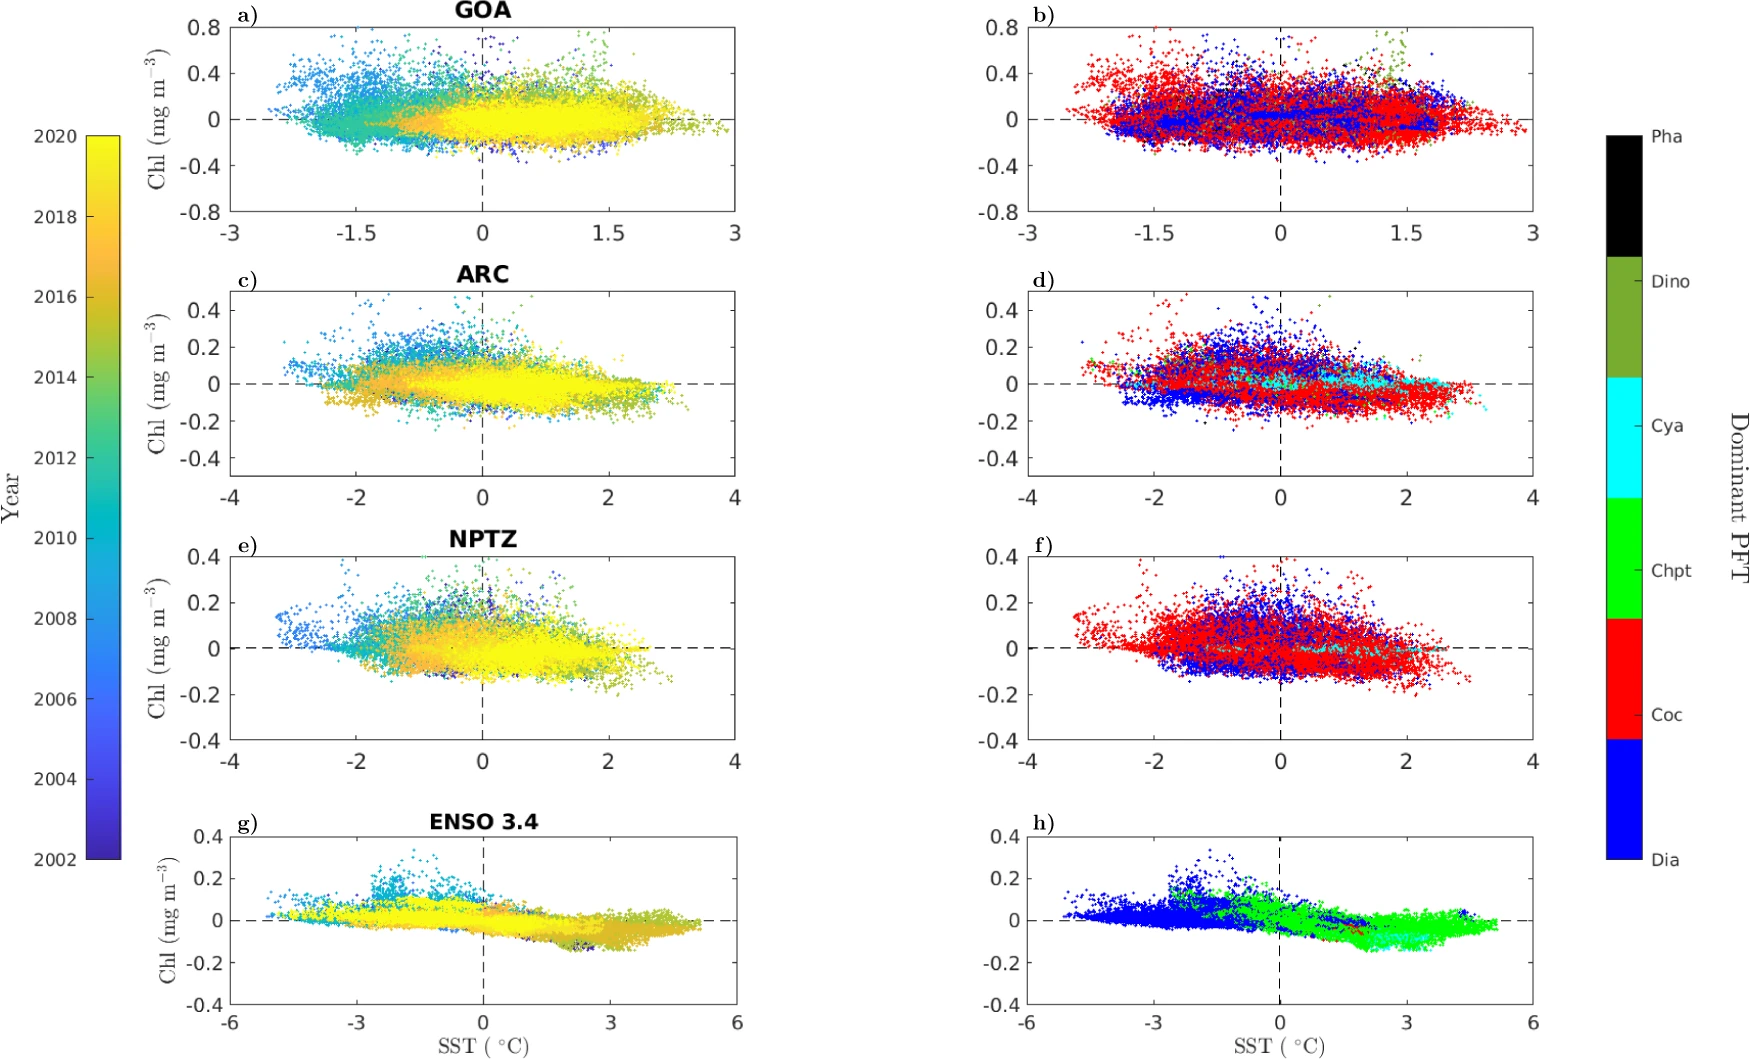
Scatterplots of modeled Chl (mg m−3) and SST (°C) anomalies in the (a, b) GOA; (c, d), ARC; (e, f), NPTZ; and (g, h) ENSO 3.4 regions of the Pacific Ocean. Each data point corresponds to a monthly grid-cell output within the specified region. The color scale of panels in the left column indicates the corresponding year of each monthly data point between 2002 and 2020. The color scale of panels in the right column indicates the dominant phytoplankton functional type (PFT) (i.e., the group that occupies the largest fraction of total Chl biomass) in each monthly grid-cell output within the specified region (diatoms-blue, coccolithophores-red, chlorophytes-light-green, cyanobacteria-cyan, dinoflagellates-dark-green, phaeocystis-black). Figure from Arteaga and Rousseaux, 2023.
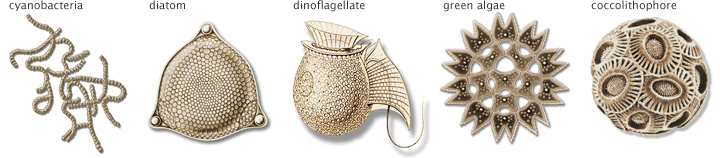
Phytoplankton vary from photosynthesizing bacteria (cyanobacteria) to plant-like diatoms to armor-plated coccolithophores (drawings not to scale). Collage by NASA Earth Observatory, adapted from drawings and micrographs by Sally Bensusen, NASA EOS Project Science Office.
“In this study, we identify the key phytoplankton groups affected by the heatwaves,” Rousseaux said. “The next step is to quantify to what extent these ecological changes reduced the production and export of organic carbon. We will conduct new model simulations at NCCS with a more complete representation of the marine carbon cycle to evaluate such changes in oceanic carbon fluxes.”
From a practical standpoint, “this type of analysis can set the basis for understanding and assessing the impact of heatwaves on species of economic relevance for coastal and open ocean fisheries,” Arteaga said. “Widening our phytoplankton groups to include toxic algae would be highly relevant for this purpose.” To better capture such ecosystem changes, the NOBM team is currently working on improving the spatial resolution of the physical ocean model and envisions expanding NOBM to represent ecological interactions throughout a larger portion of the marine food web.

a, b: Mean anomaly in modeled surface (a) silicate (μ mol kg−1) and (b) iron (nmol kg−1). c–h: Mean anomaly in the modeled surface chlorophyll biomass (mg m−3) of (c) diatoms, (d) dinoflagellates, (e) cyanobacteria, (f) chlorophytes, (g) coccolithophores, and (h) phaeocystis. Figure from Arteaga and Rousseaux, 2023.
Related Links
- Arteaga, L.A., and C.S. Rousseaux, 2023: Impact of Pacific Ocean Heatwaves on Phytoplankton Community Composition. Communications Biology, 6, 263, doi:10.1038/s42003-023-04645-0.
- “Impact of Pacific Ocean Heatwaves on Phytoplankton Community Composition,” GMAO Science Snapshot, April 11, 2023.
- NASA Ocean Color Web.
Jarrett Cohen, NASA Goddard Space Flight Center
June 16, 2023