NCCS and EIS Enable Research on Flood Monitoring and Forecasting, Human
Impacts on Louisiana Flooding – and Eventually, Across the Globe
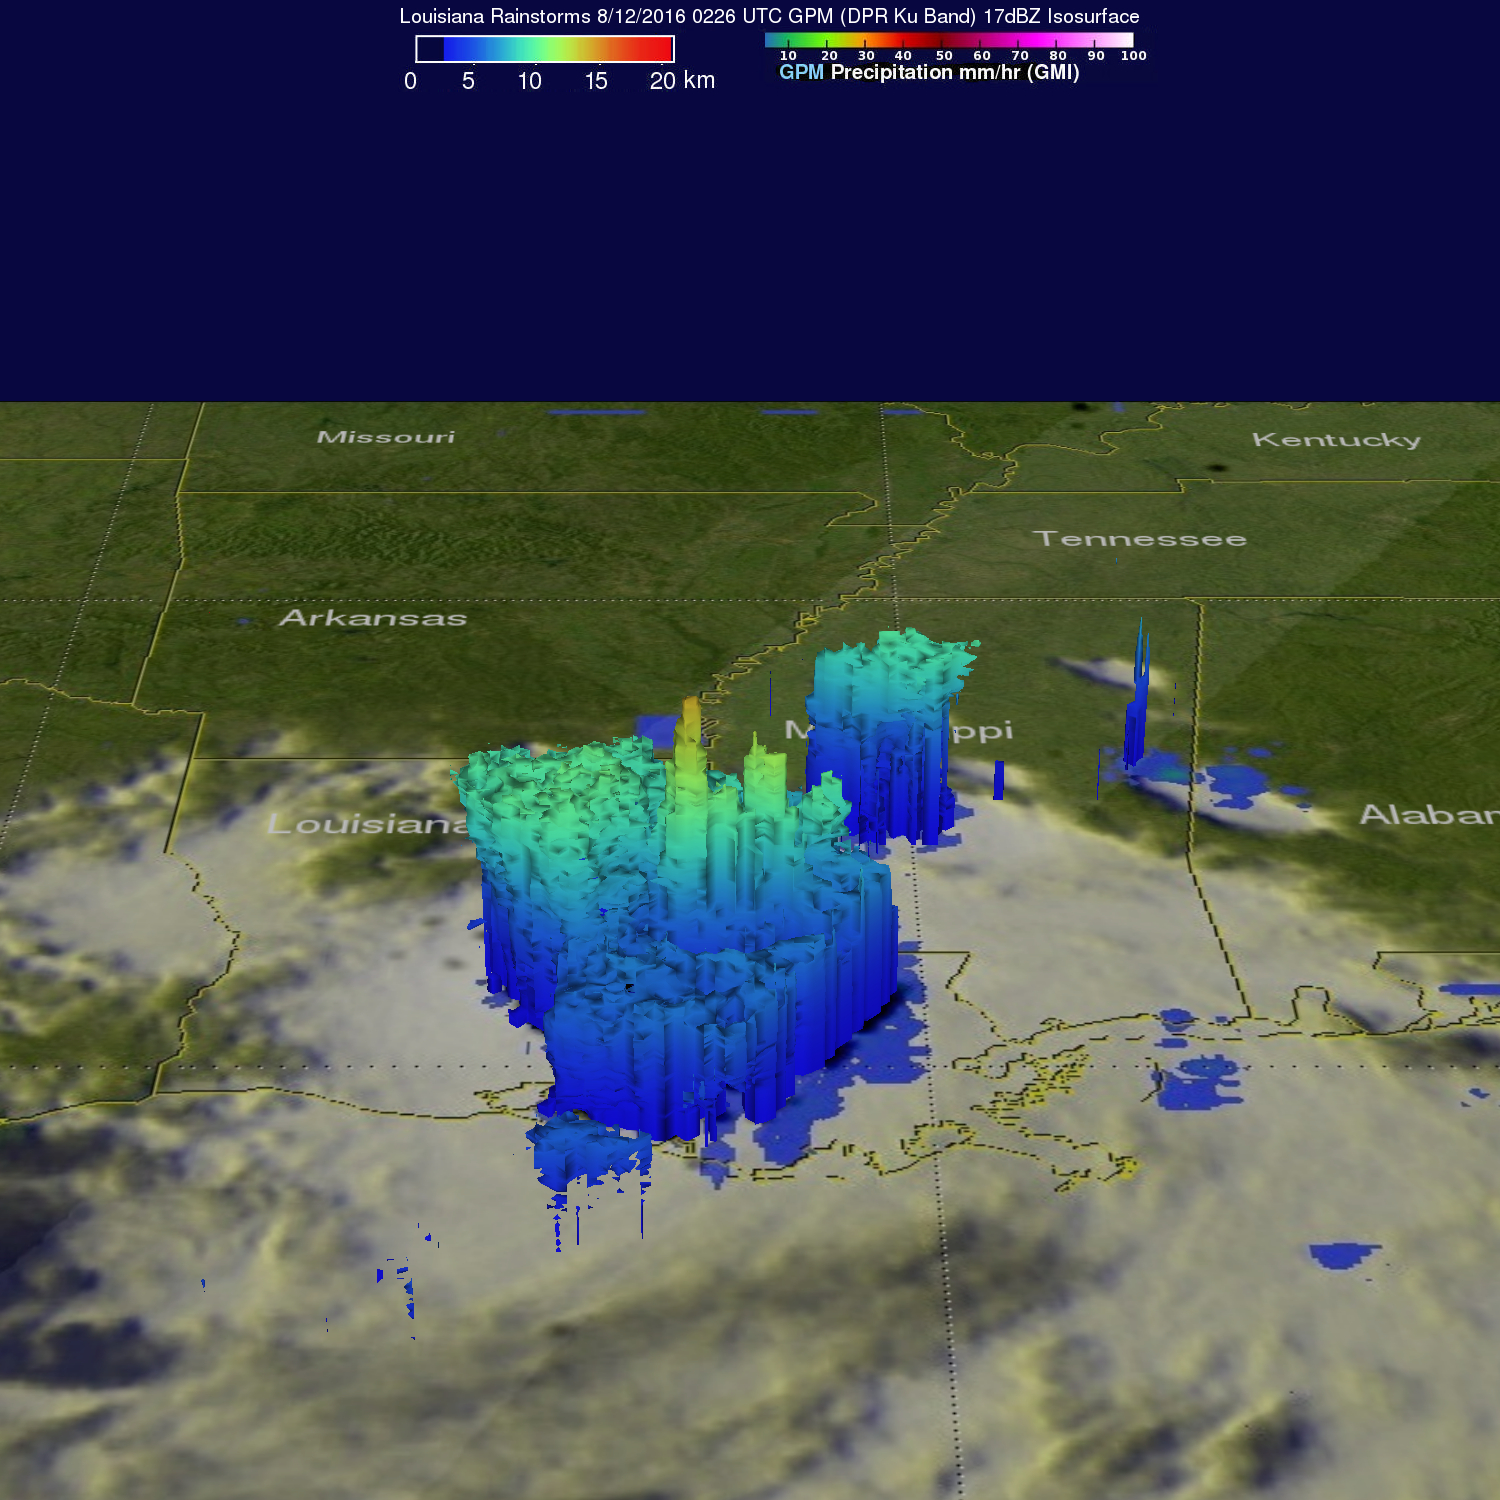
This 3D image of cloud heights and precipitation rates on 11 August, 2016 was developed using satellite data from the NASA/JAXA Global Precipitation Measurement (GPM) mission. GPM found that heavy rain was falling at a rate of over 100 mm (~4 inches) per hour during an intense downpour in Louisiana – a snapshot in time from the multi-day, slow-moving, intense, flooding rainstorm. A few of these storm tops reached heights of over 16 kilometers (9.9 miles). Credits: NASA/JAXA/Hal Pierce.
This scientific visualization in this video reveals the GPM-captured, internal structure of the 2016 storm complex. Video by NASA Goddard Space Flight Center.
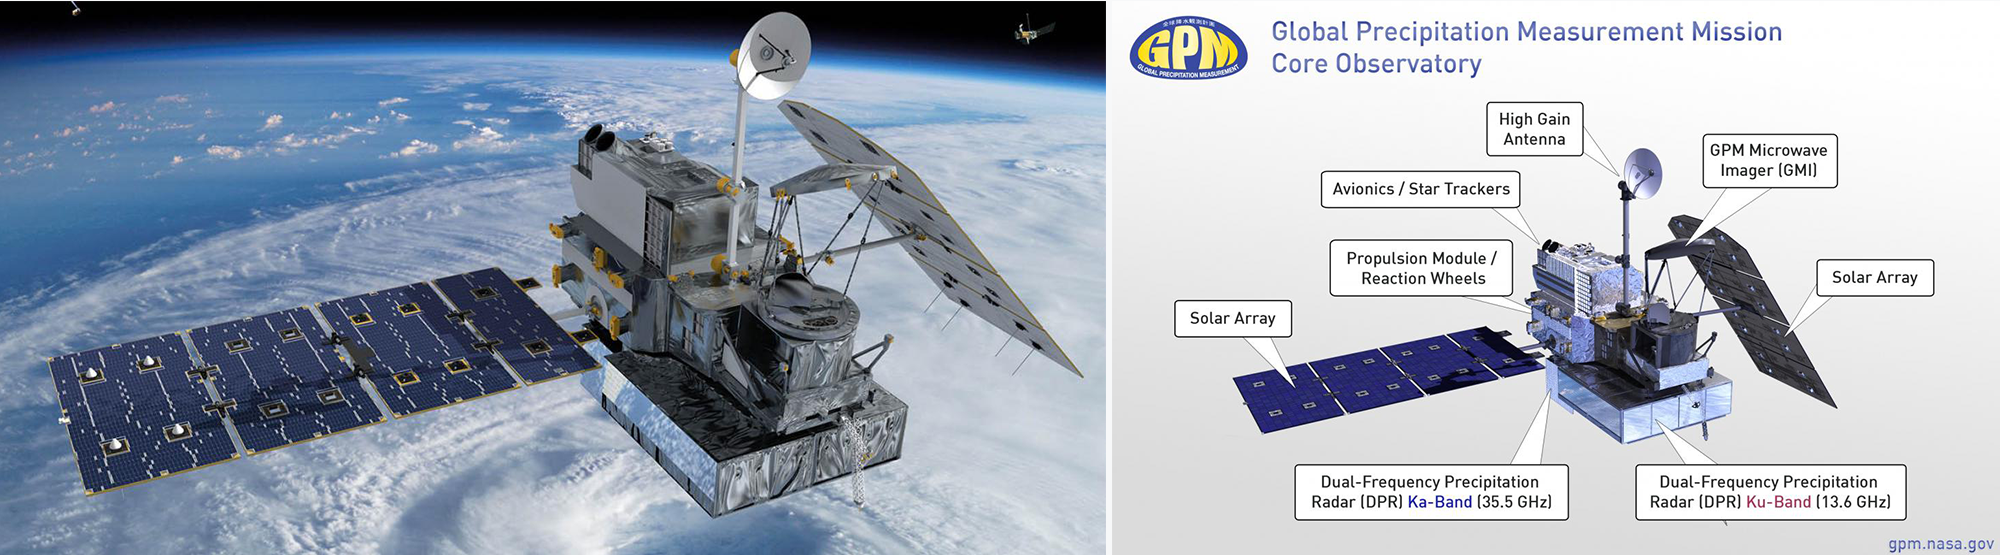
Left: An artist’s conception of the GPM Core Observatory satellite. Credit: NASA/JAXA. Right: An illustrated diagram of the GPM satellite’s solar arrays; parabolic, high-gain radio antenna; and three data collection instruments – a passive, S-band microwave imager; dual-frequency, Ka-band precipitation radar; and dual-frequency, Ku-band precipitation radar. Click here to understand the various radar bands and here for their features.
In this story, we first explore how research scientist Augusto Getirana in the Hydrological Sciences Laboratory at NASA Goddard Space Flight Center and his colleagues conducted research on flooding in southern Louisiana to measure climate-induced hydrological change (i.e., the movement, distribution, and management of water on Earth induced by climate change), water management, and sea level rise. The goal of the study is to eventually broaden and apply the process to better understand and forecast flood risk at a global level, ultimately helping water managers plan interventions that can increase flood resilience.
Next, we provide a closer look at the extreme, widespread, and catastrophic flooding from a multi-day, slow-moving storm system rotating over Louisiana in August 2016 through photos, data, animation, and scientific visualization.
Finally, in the interview below, we explore how Getirana’s career led him from southwestern Brazil to southern France and eventually to the U.S. Mid-Atlantic region, working at NASA Goddard. We discover what inspired Getirana, who dreamed of working at NASA while a civil engineering graduate student back in his home town of Rio de Janeiro (a UNESCO World Heritage Center) to study Earth science in Toulouse, France (site of another UNESCO World Heritage Center, where the 16th century marvel of civil engineering, the 240 kilometer long Canal du Midi, connects with the Canal de Garonne).
The focus of NASA Goddard’s Hydrological Sciences Laboratory is to develop remote sensing and modeling techniques that improve the understanding of how various components of the hydrological cycle interact over a broad range of spatial and temporal scales, thus producing important information about the current structure of global hydrology and how humanity is changing Earth’s hydrological environment.
As climate-induced hydrological extremes continue to increase across the globe and negatively impact greater numbers of people, it has become increasingly vital to measure, understand, and forecast how various factors increase flood risk in many regions across the globe. NASA reports that floods are the most common natural disaster worldwide — and in the United States, they result in more loss of life and property than any other type of natural disaster.
Recent studies highlight how local investments in simple flood preparations can prevent as much as 70% of property damage during a flood. But to achieve those benefits on a global scale, we need better data, better modeling, and a deeper understanding of flood exposure. That is why NASA’s fleet of Earth-observing satellites, including the Global Precipitation Measurement (GPM) Core Observatory, is helping scientists and decision-makers improve flood prediction, preparation, response, and recovery. NASA flood preparedness and response capabilities include satellite observations, data systems, and modeling. Learn more about the NASA instruments and tools helping local communities in pre-flood, active, and post-flood situations on the NASA Applied Sciences page.
Keenly aware of major hydrological changes in this region of Louisiana in recent years and due to the tangible importance of the world’s river deltas to agriculture, ecosystem services, and the estimated half-billion people who live in these nutrient-rich, high-density areas, Getirana and his collaborators teamed up to measure the impacts of climate-induced hydrological change, water management, and sea level rise on southern Louisiana flooding.
Starting in 2021, Augusto Getirana led a research team involving colleagues from NASA Goddard’s Hydrological Sciences Laboratory and Geodesy and Geophysics Laboratory, both in Greenbelt, Maryland; Johns Hopkins University in Baltimore, Maryland; the University of Maryland in College Park, Maryland; Kellogg Brown & Root (KBR) in Columbia, Maryland; and the NASA Jet Propulsion Laboratory in Pasadena, California. The researchers recently published their results in the journal Water Resources Research.
Although there have been several studies on the impacts of sea level rise, subsidence (both natural and human-induced), and local processes on flooding risk, the study of climate-induced hydrological change interacting with sea level rise has not been as closely investigated and measured in terms of their combined impact on river deltas. Using this novel combination of interactions, Getirana and his collaborators measured the impacts of climate-induced hydrological change, water management, and sea level rise on Louisiana flooding by developing a new model.
Rectangles shown in the map below (left) represents the extent of the team’s chosen study area of southern Louisiana. Black triangles indicate the location of the seven U.S. Geological Survey (USGS) inflow gauges where observational data was collected and used to define upstream boundary conditions in the study model. In the map, note the locations of the Old River Control Structure (ORCS) in Central Louisiana; the Morganza Floodway, south of the ORCS; and the Bonnet Carré Floodway in the Lower Mississippi Valley. (Photos of all three U.S. Army Corps of Engineers projects are shown further below.)
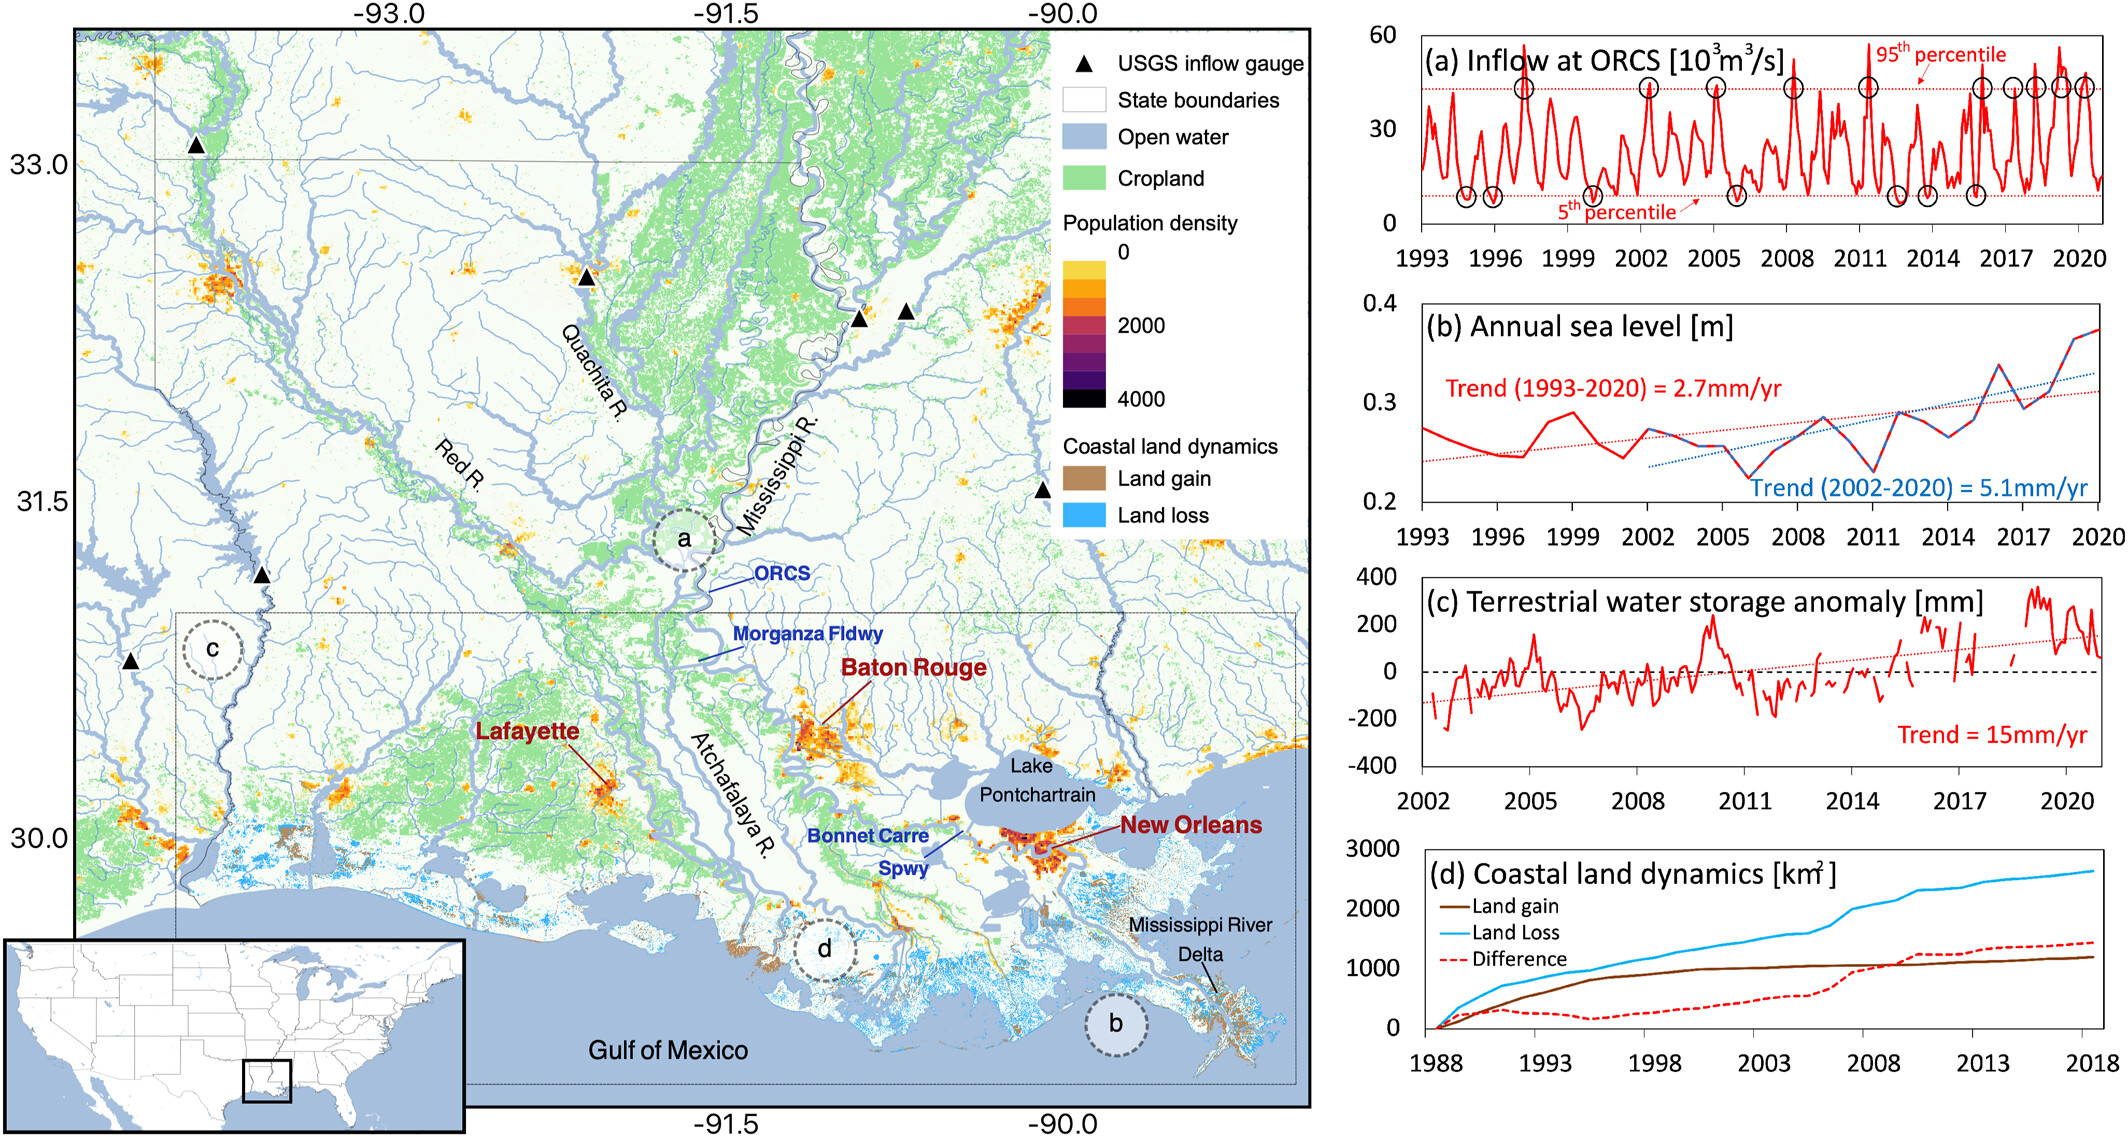
Above: On the left is a map showing the study area in southern Louisiana. On the right the graphs show (a) monthly inflow at the Old River Control Structure (ORCS), (b) annual sea level at the delta, (c) terrestrial water storage (TWS) anomaly over land within the box defined on the large map over 2002–2020, and (d) coastal land gain and loss over 1988–2018. Circles in (a) indicate periods when inflow is above the 95th percentile or below the 5th percentile during 1993–2020. A positive trend is observed in the annual sea level over the same period in (b), with an increased slope since 2002. Similar trends are observed in TWS since 2002 in (c) and coastal land loss since 1988 in (d).
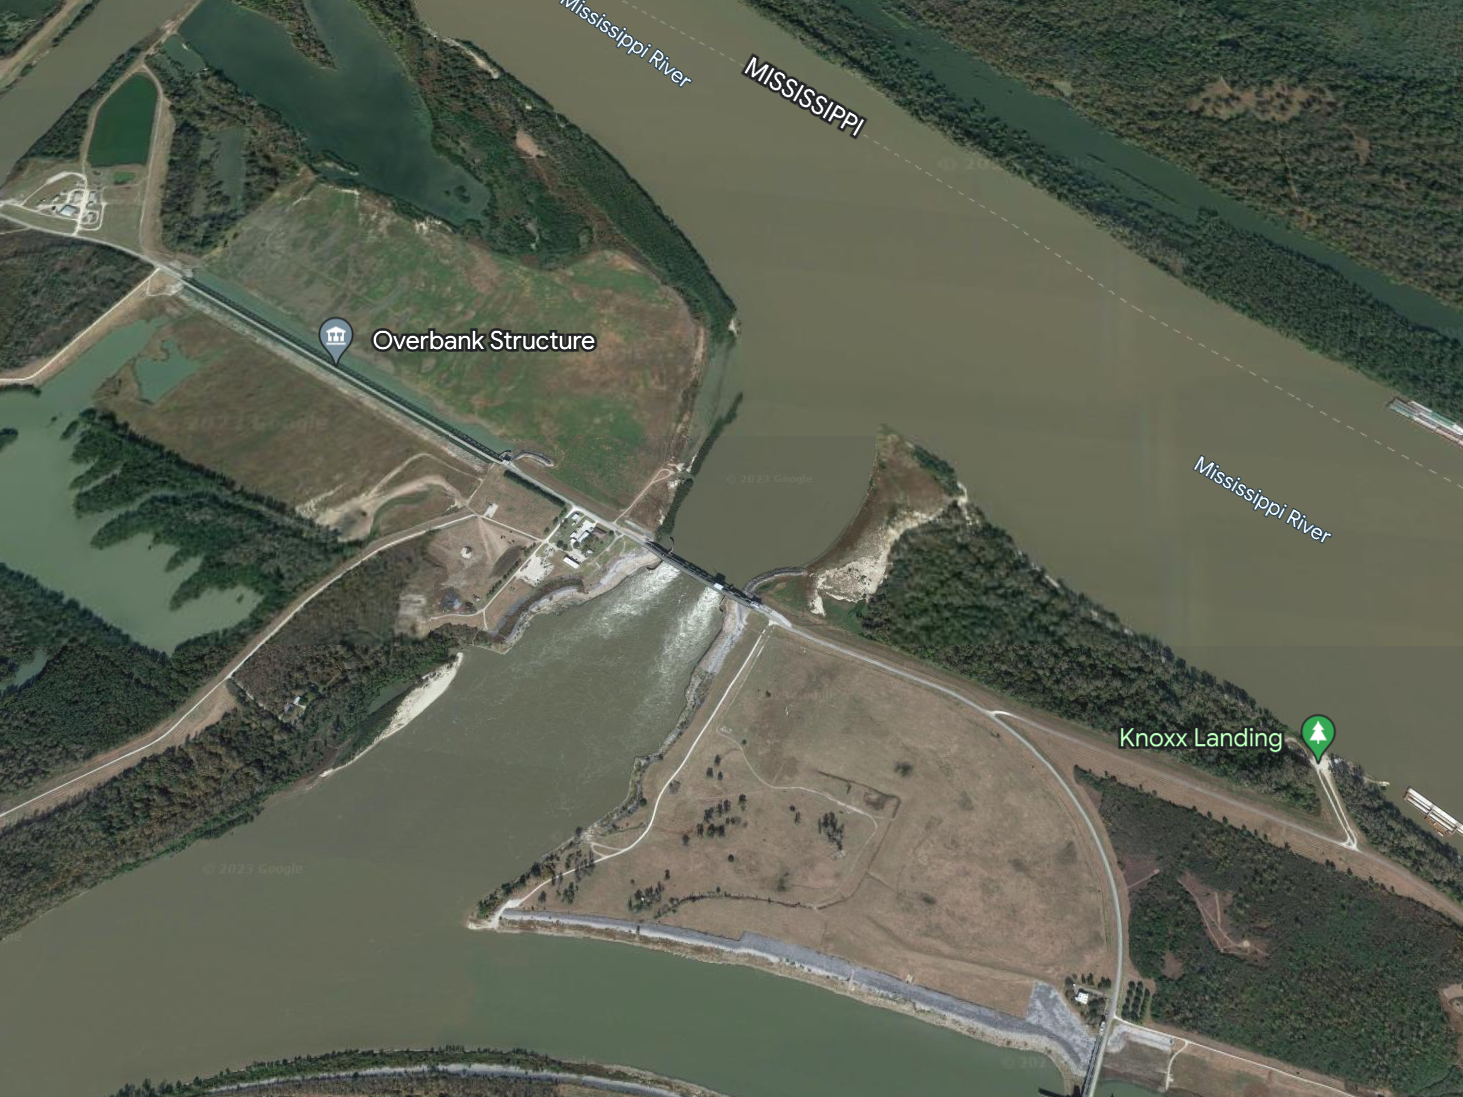
A Google Earth view of the Old River Control Structure near Fort Apache, Louisiana. The structure diverts water from the south-flowing Mississippi River west via an outflow channel to the Red River, which then flows south into the Atchafalaya River and empties into the Gulf of Mexico at the Atchafalaya Delta. Note that almost 1/3 of the Atchafalaya River volume flows into Yellow Bayou and then into the Gulf via the Wax Lake Outlet, an artificial channel created by the United States Army Corps of Engineers in 1942 to reduce flood stages at Morgan City, Louisiana.
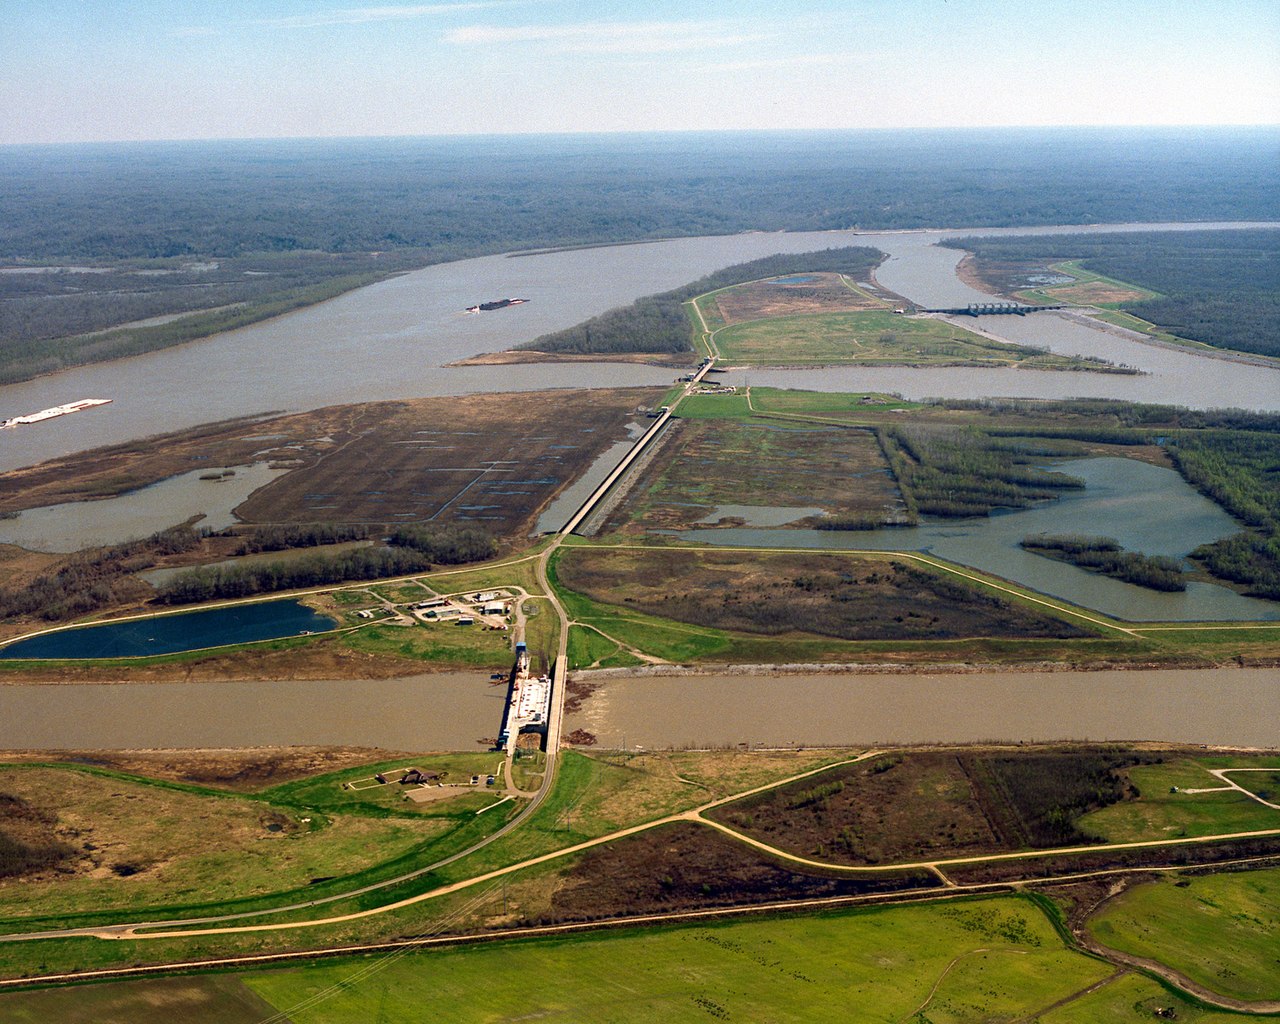
A view looking east-southeast of the Old River Control Structure at the juncture of the Mississippi River and the Atchafalaya River. In this photograph, the Mississippi River enters from the left (north) and curves away to the right (south) in the distance. The Atchafalaya River meets the Mississippi at three points and runs off to the bottom right. Control structures (dams) at each of the three forks of the Atchafalaya prevent most of the waters of the Mississippi from running into the Atchafalaya. The design of the structures is intended to keep 70% of the water in the Mississippi and 30% flowing into the Atchafalaya. The control structures are located at river mile 315 on the Mississippi (315 miles from the Gulf of Mexico). Photo from the U.S. Army Corps of Engineers Digital Visual Library.
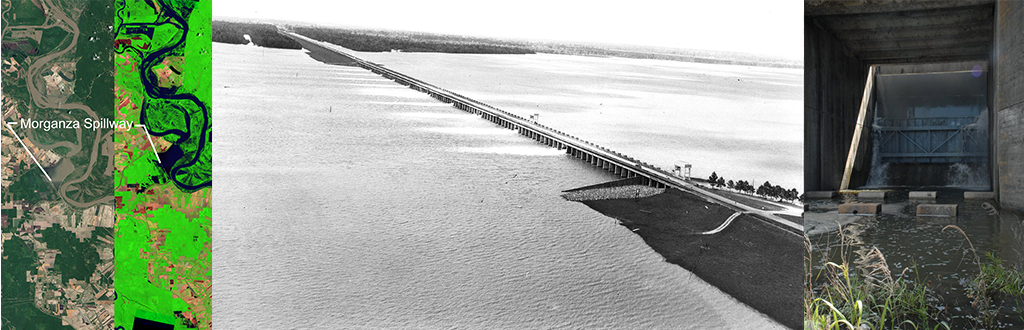
Left to right: 1. Natural-color image of the Morganza Floodway. The image was acquired at 11:20 a.m. Central Daylight Time, one day after the spillway was partially opened. The white pixels near the spillway are whitewater churned up by the flow through the gates. Square and quadrilateral shapes on the landscape show areas that were cleared for farming or perhaps shaped for flood control earthworks. Water ranging in colors from olive, to light brown, to gray, and to black reflect the different loads of muddy sediment churned up from the bottom; darker areas might also reflect deeper water. Past the spillway, water is more readily apparent along the levee on the south and east side of the floodway, suggesting that there are fewer trees and perhaps lower elevations in those areas. 2. A false-color image of the Morganza Floodway. Image captured by the Advanced Land Imager (ALI) on NASA’s Earth Observing-1 (EO-1) satellite. Photo by NASA Earth Observatory/Jesse Allen and Robert Simmon. 3. Aerial view of the Morganza Spillway, between the Mississippi River and the Atchafalaya Basin, shown while open in 1973. Water flows from the Mississippi (upper right) into the Morganza Floodway (lower left). Photo by the U.S. Army Corp of Engineers. 4. One of the 125 gates on the tail bay side of the Morganza Floodway. Photo by the U.S. Army Corp of Engineers.
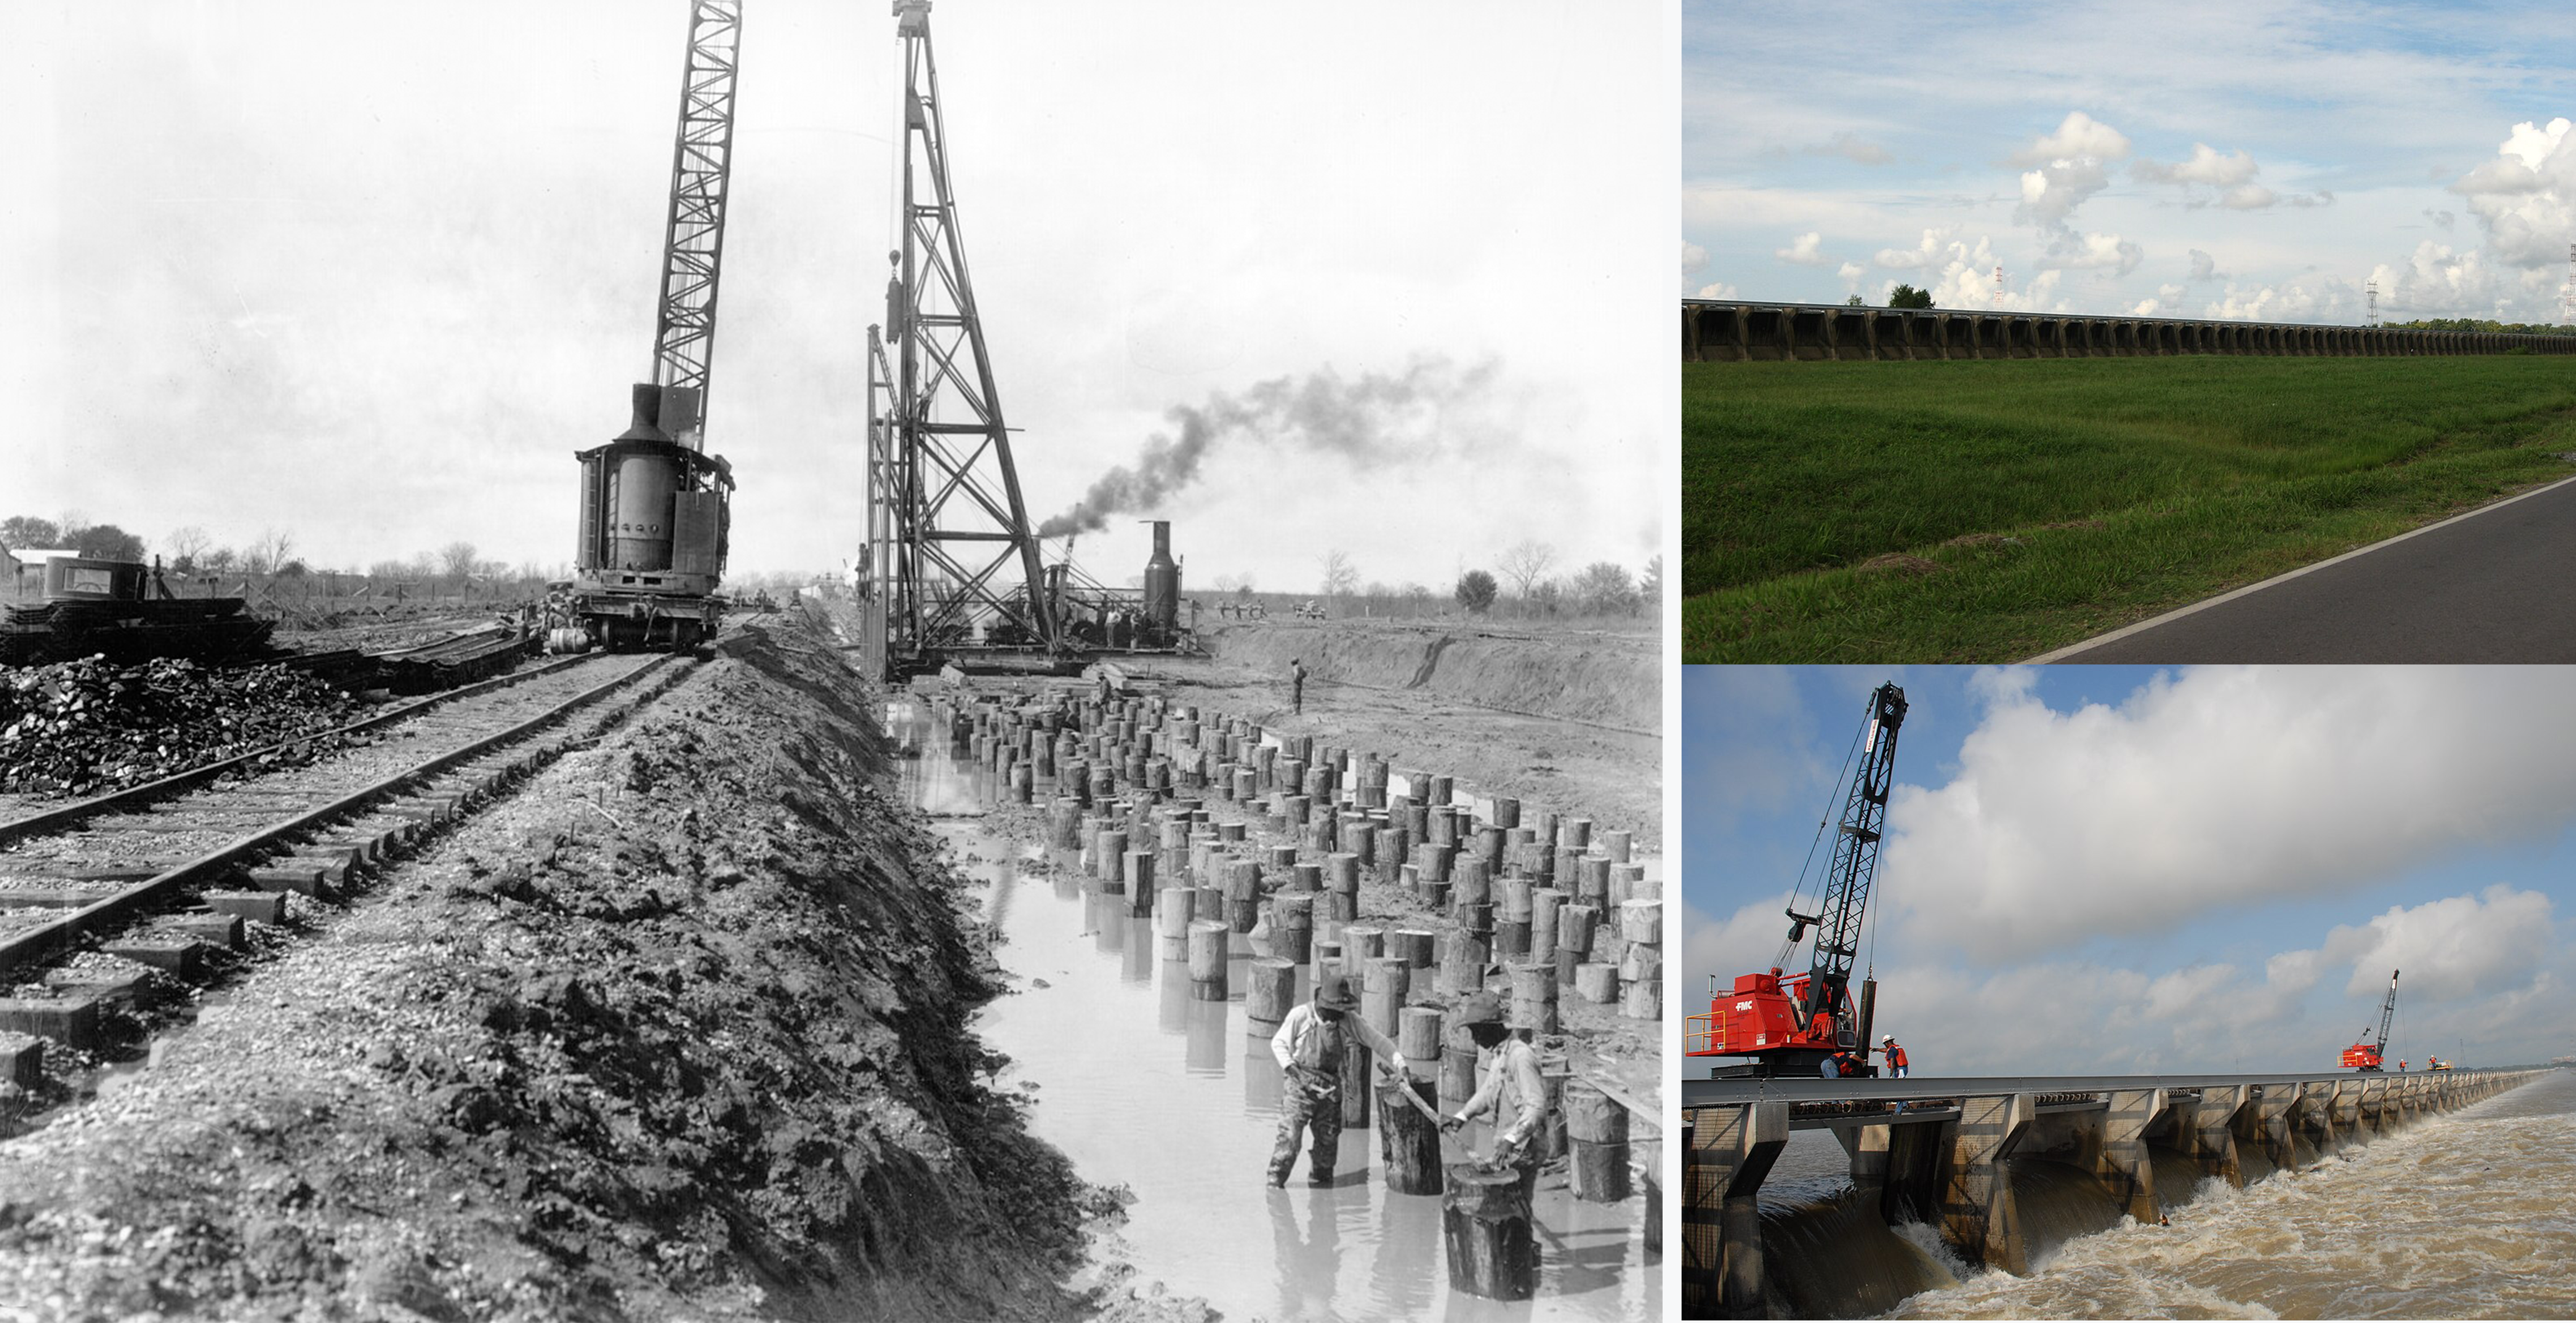
Left: A black-and-white photograph of the construction of the Bonnet Carré Spillway in 1929. Photo by the U.S. Army Corps of Engineers, CC BY 2.0, via Wikimedia. Right, top: Driving along the road that is closed and under water when the spillway floodgates are opened. Photo by the U.S. Army Corps of Engineers, CC BY-SA 2.0, via Wikimedia. Right, bottom: A view of the spillway when the gates are open and diverting excess Mississippi River water. 2009 photo by the U.S. Army Corps of Engineers.
To develop this unique model that combines climate-induced hydrological change interacting with sea level rise and water management, the team used data and sources including:
- Coastal land dynamics from NASA's Delta-X land change map
- Cropland Support Analysis Data from the USGS Global Food Security
- Digital elevation model of the land surface from MERIT Hydro
- Inland water level from NASA’s Global Water Monitor
- Meteorological forcings from the NASA MERRA-2 weather forecast reanalysis
- Operation of flood control structures from the U.S. Army Corps of Engineers
- Population density data from the Center for International Earth Science Information Network
- River geometry from the U.S. Geological Survey’s streamflow measurements
- Sea level data from the Copernicus Marine Environmental Monitoring Service
- Streamflow data from the US Geological Survey’s National Water Information System
- Terrestrial water storage mass concentration blocks (mascons) from NASA Goddard’s GRACE missions
The results of this research were that the team was able to model and measure how climate-induced hydrological changes (CHC) impact Southern Louisiana’s water dynamic in synergy with sea level rise (SLR) using the same levels of water management, as shown in the figure below.
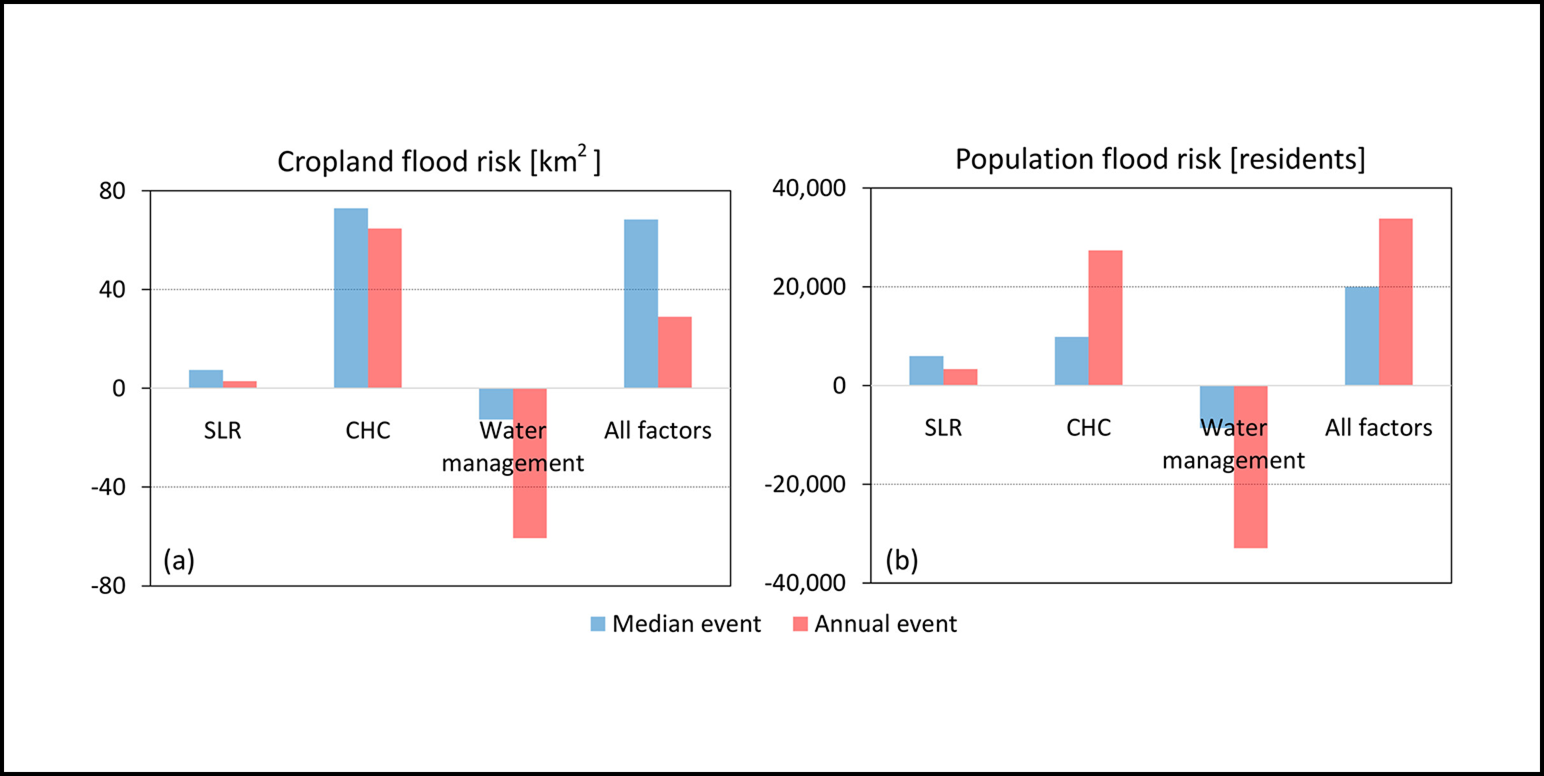
Above: The graphs from Getirana et al. summarize how different climate and human factors contribute to southern Louisiana's flood risk. CHC-induced flooding currently puts an additional 73 square kilometers (km) of cropland under flood risk at least half of the time (median flood event) and 65 square km once a year (annual flood event), compared to the early study period. That is a 10- to 20-fold increase relative to SLR-induced flooding, which is mostly detected over coastal zones. CHC also increases population vulnerability to flooding; an additional 9,900 residents currently live under flood risk at least half of the time, and that number increases to 27,400 for annual flood events. The number of residents vulnerable to SLR-induced flood risk is substantially lower (6,000 and 3,300 residents, respectively), since SLR mostly impacts wetlands and their surroundings, which are not as socioeconomically developed. These results suggest that CHC is a major driver of flood risk over southern Louisiana. Water management, on the other hand, diverts floodwaters away from croplands and population centers, such as Baton Rouge and New Orleans, into the Atchafalaya River. These results demonstrate that flood control structures play a vital role not only in protecting the people in southern Louisiana, but also in keeping a significant area of cropland flood-free and productive.
Summary of findings:
1. Climate-induced hydrological change (the movement, distribution, and management of water on Earth induced by climate change) is an important factor in flooding risks to people and property;
2. The impacts of sea level rise are limited to coastal zones — the boundary area between the land and the coastline; and
3. Water management in southern Louisiana is critical to mitigating flood risk, particularly for croplands and major cities.
Impact: By using the same process of modeling climate-induced hydrological change interacting with sea level rise at a global level, Getirana and his colleagues hope to apply the methodology to better understand and forecast flood risk across the globe, ultimately helping water managers plan interventions that can increase flood resilience.
Another important aspect of this study is that Getirana and his colleagues were able to account for the management of the three U.S. Army Corps of Engineers’ flood control structures – the Old River Control Structure, the Morganza Floodway, and the Bonnet Carré Spillway – and quantify their impacts on flood prevention.
To accomplish this study, Getirana’s team were supported by the resources of the Earth Information System (EIS), a pilot project supported by the NASA Center for Climate Simulation (NCCS) and the NASA Science-Managed Cloud Environment.
“NCCS gives us at NASA Goddard a unique capability to study Earth as no other research center worldwide,” Getirana said. “We are the vanguard in global land surface modeling and satellite data assimilation, and this is largely enabled by NCCS supercomputers. Such capabilities allowed us to closely look at floods in southern Louisiana using both computational models and satellite data. We are now at the point where we can expand the analysis to the whole continental U.S., then the globe.”

Above: The radar loop from the National Weather Service shows the heavy rainfall from August 11–13, 2016, causing widespread flash floods and record river flooding along coastal Louisiana and Mississippi. The changing date and time in GMT are seen at top right of the animation. At bottom right of the animation is the color-coded precipitation intensity scale, decibel relative to Z (dBZ). The radar reflectivity (Z) of a cloud is dependent on the number and size of reflectors (like raindrops, snowflakes, hail, or graupel). So, the higher the dBZ, the heavier the precipitation. For example, strong radar reflectivity values greater than 45 dBZ (yellow-orange) indicate “moderate to heavy rain,” and at 55 dBZ, (red-orange), “very heavy rain with hail likely” is indicated. Animation credit: National Weather Service New Orleans/Baton Rouge (NWS LIX) Weather Forecast Office. Below, right: This hydrograph from the National Weather Service shows the rapid rise of the Amite River at Magnolia from 30 feet to the crest of 58.6 feet in 5 days.
 Though not technically a hurricane, the combination of an extremely moist, tropical air mass with a large (>100 kilometers) and organized complex of thunderstorms that were nearly stationary for several days in August 2016 – trapped by upper-level high pressure – brought several feet of rain and massive flooding to southern Louisiana.
The historic event caused devastation, with tens of thousands of people stranded and requiring water rescues. 11,000 emergency shelters in the region were established, housing thousands of displaced Louisiana citizens. 146,000 homes and other buildings were flooded, and several people lost their lives.
As much as 30 inches (762 millimeters) of rain fell on some areas of the state during this slow-moving 2016 storm – an estimated 7.1 million gallons in total – more than triple the amount of rain dumped on Louisiana by Category 5 Hurricane Katrina. The destructive 2016 rainstorm led to record flooding of five Louisiana rivers. In just one example, in the town of Magnolia, Louisiana, the Amite River rose 28 feet during the rain event, cresting at 58.4 feet.
A photo taken on August 15, 2016, from a medevac-capable search and rescue helicopter shows flooding and devastation in one area of the city of Baton Rouge, Louisiana. U.S. service members rescued residents and provided relief. Photo by U.S. Coast Guard Petty Officer 1st Class Melissa Leake provided by the U.S. Department of Agriculture, CC BY 2.0, via Wikimedia.
Left: Members of the U.S. Coast Guard rescue stranded residents from high water during severe flooding around Baton Rouge, Louisiana, on August 14, 2016. Photo by U.S. Coast Guard Petty Officer 3rd Class Brandon Giles, CC BY 2.0, via Wikimedia. Right: Soldiers from the Louisiana National Guard's 2228th Military Police Company set up cots inside the Baton Rouge River Center on August 15, 2016, after major flooding made their homes unlivable. Photo by U.S. Army National Guard Specialist Garrett L. Dipuma, CC BY 2.0, via Wikimedia.
Left: Map showing the 21 Louisiana parishes that were declared federal disaster areas by the Federal Emergency Management Agency (FEMA) after the 2016 Louisiana floods. Map by Wclarke, CC BY 4.0, via Wikimedia Commons, unedited. Right: District map showing Louisiana parish names and their respective district numbers. Map produced by the Louisiana Department of Transportation.
Hometown: My hometown is Rio de Janeiro, Brazil. I grew up in the Barra da Tijuca neighborhood of Rio, a 10-minute walk from the beach.
The hill that you see in most of the pictures of my neighborhood is called Pedra da Gávea (Rock of the Topsail), where I used to hike to the top with my friends. It's ~850 meters (2,800 feet) high and the notable landmark of the area. But my passion was always to spend time at the beach.
I studied civil engineering for my bachelor’s and master’s degrees at the Federal University of Rio de Janeiro. I left Rio when I was in my twenties, and although I've been away for 17 years, except for visits, Rio is still my hometown.
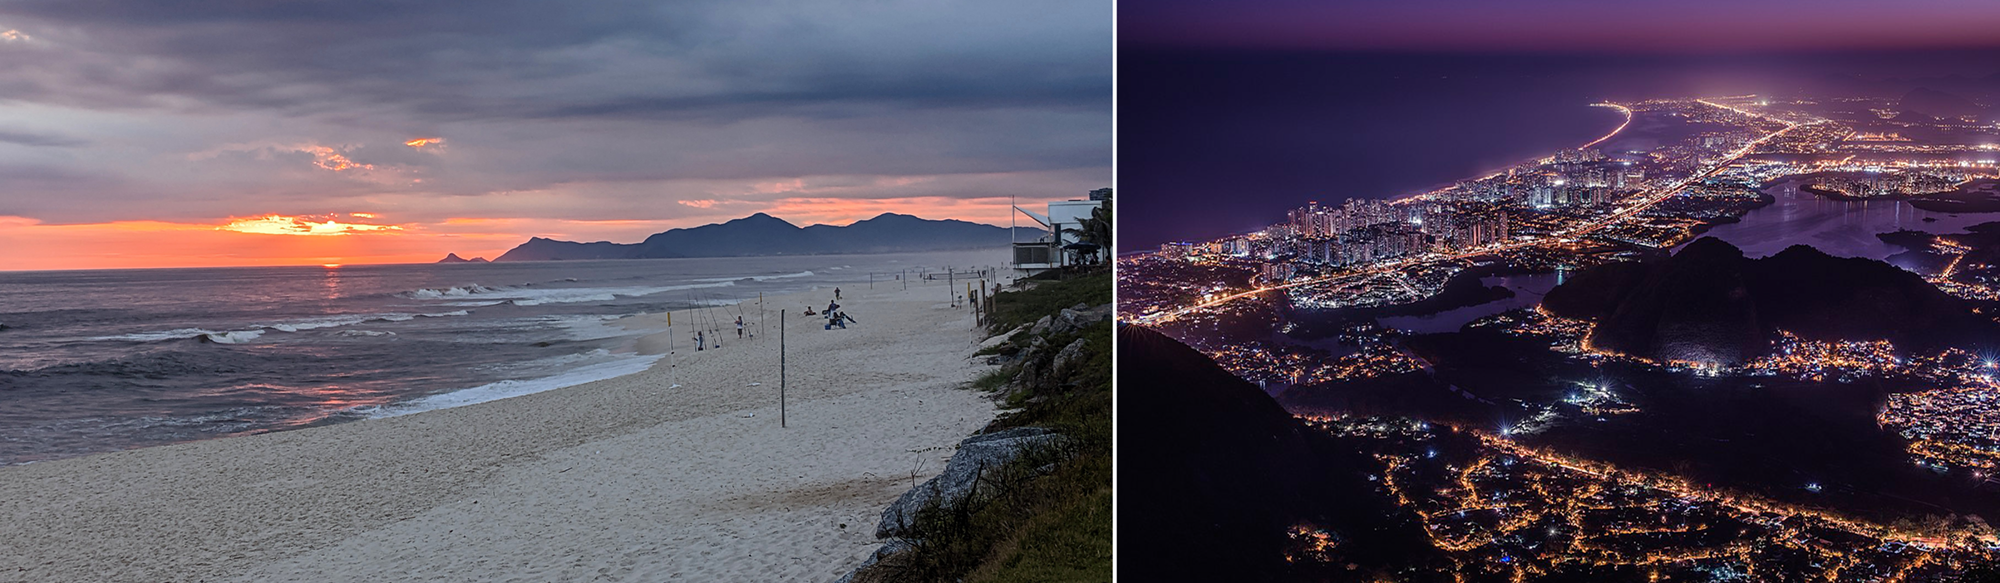
Left: A sunset view of the long and curving Barra da Tijuca beach in Rio de Janeiro. Photo courtesy of Augusto Getirana. Right: A view at night, facing southwest, of the long curve of the Barra da Tijuca Beach and the adjacent Barra da Tijuca neighborhood in Rio de Janeiro, Brazil, where Augusto Getirana grew up. Night photo taken from the top of Pedra Bonita, (693 meters), by Caio Basilio, CC BY-SA 3.0, via Wikimedia.
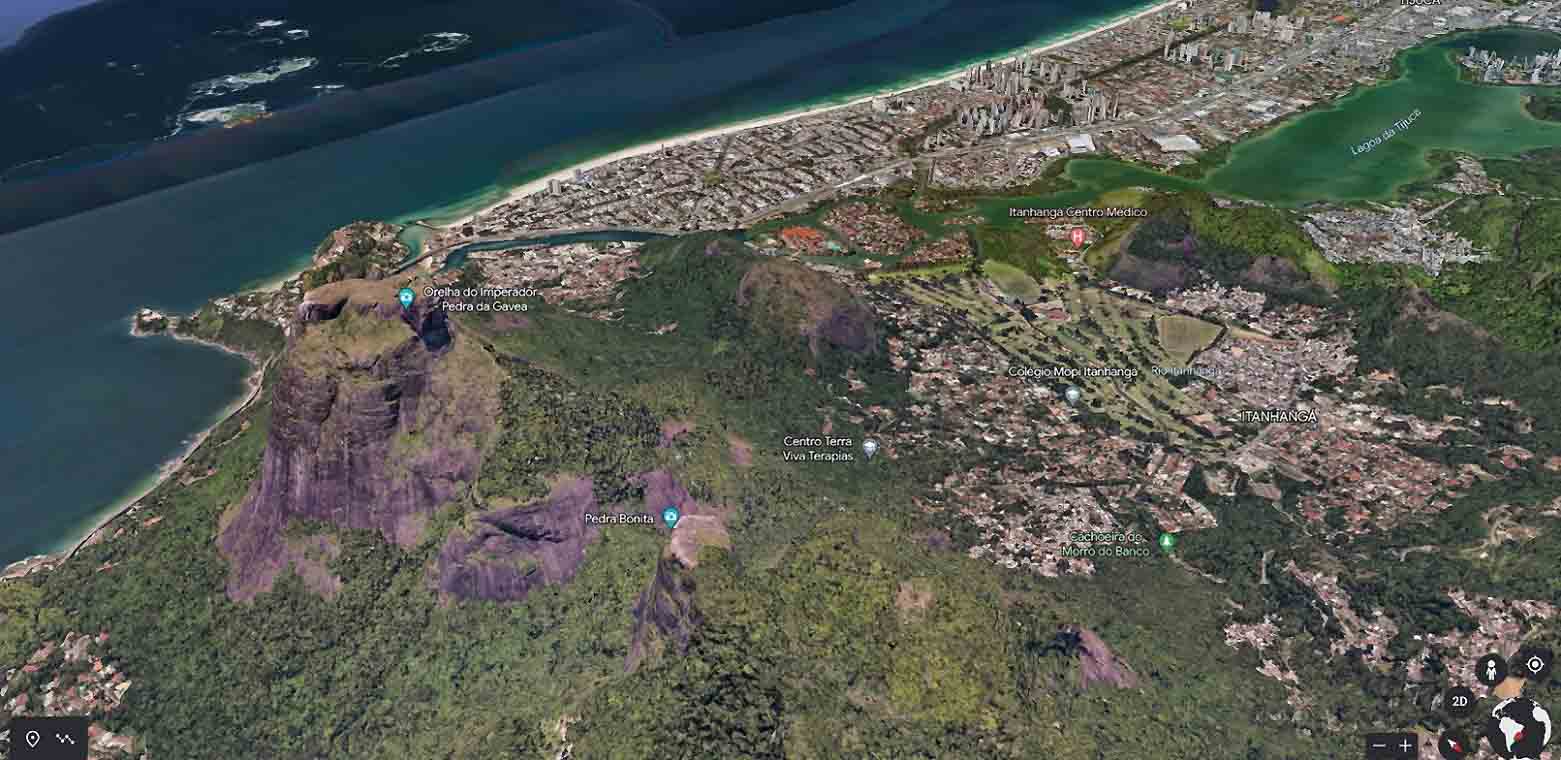
A Google Earth view, facing southwest, of Pedra da Gávea (Rock of the Topsail) and Pedra Bonita (Beautiful Rock) located inside Brazil’s Tijuca National Park. Both rocks are composed of coarse, hard granite monoliths atop eroded mounds of gneiss.
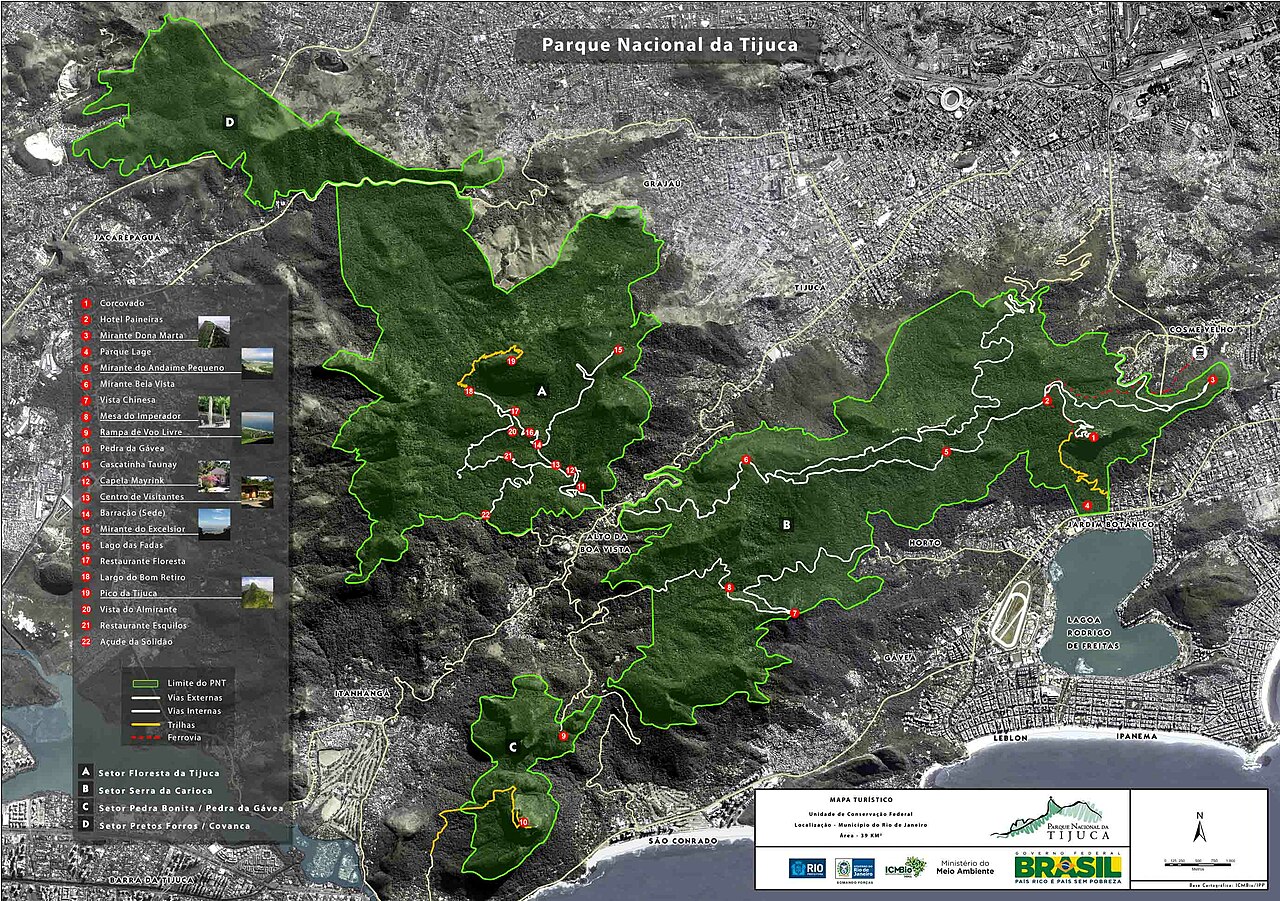
A visitor map showing the extent of one of the largest urban forests in the world –Tijuca National Park in Getirana’s hometown of Rio de Janeiro, Brazil. Park map acquired via Wikimedia.
What or who inspired you to study civil engineering? I have always been a curious kid and had an interest in both numbers and science, and I always did well in disciplines like math, physics, chemistry, and biology. Science in Brazil isn't as well communicated as it is here in the U.S., so back in Rio, when I was a high school senior at 16, I thought that studying engineering – particularly civil engineering – was the way to go for someone with my skill set. When I started working as an intern in engineering offices calculating offshore structures and designing urban sanitation networks, I realized that civil engineering as a career wasn't for me, because I didn't find the challenges that I needed.
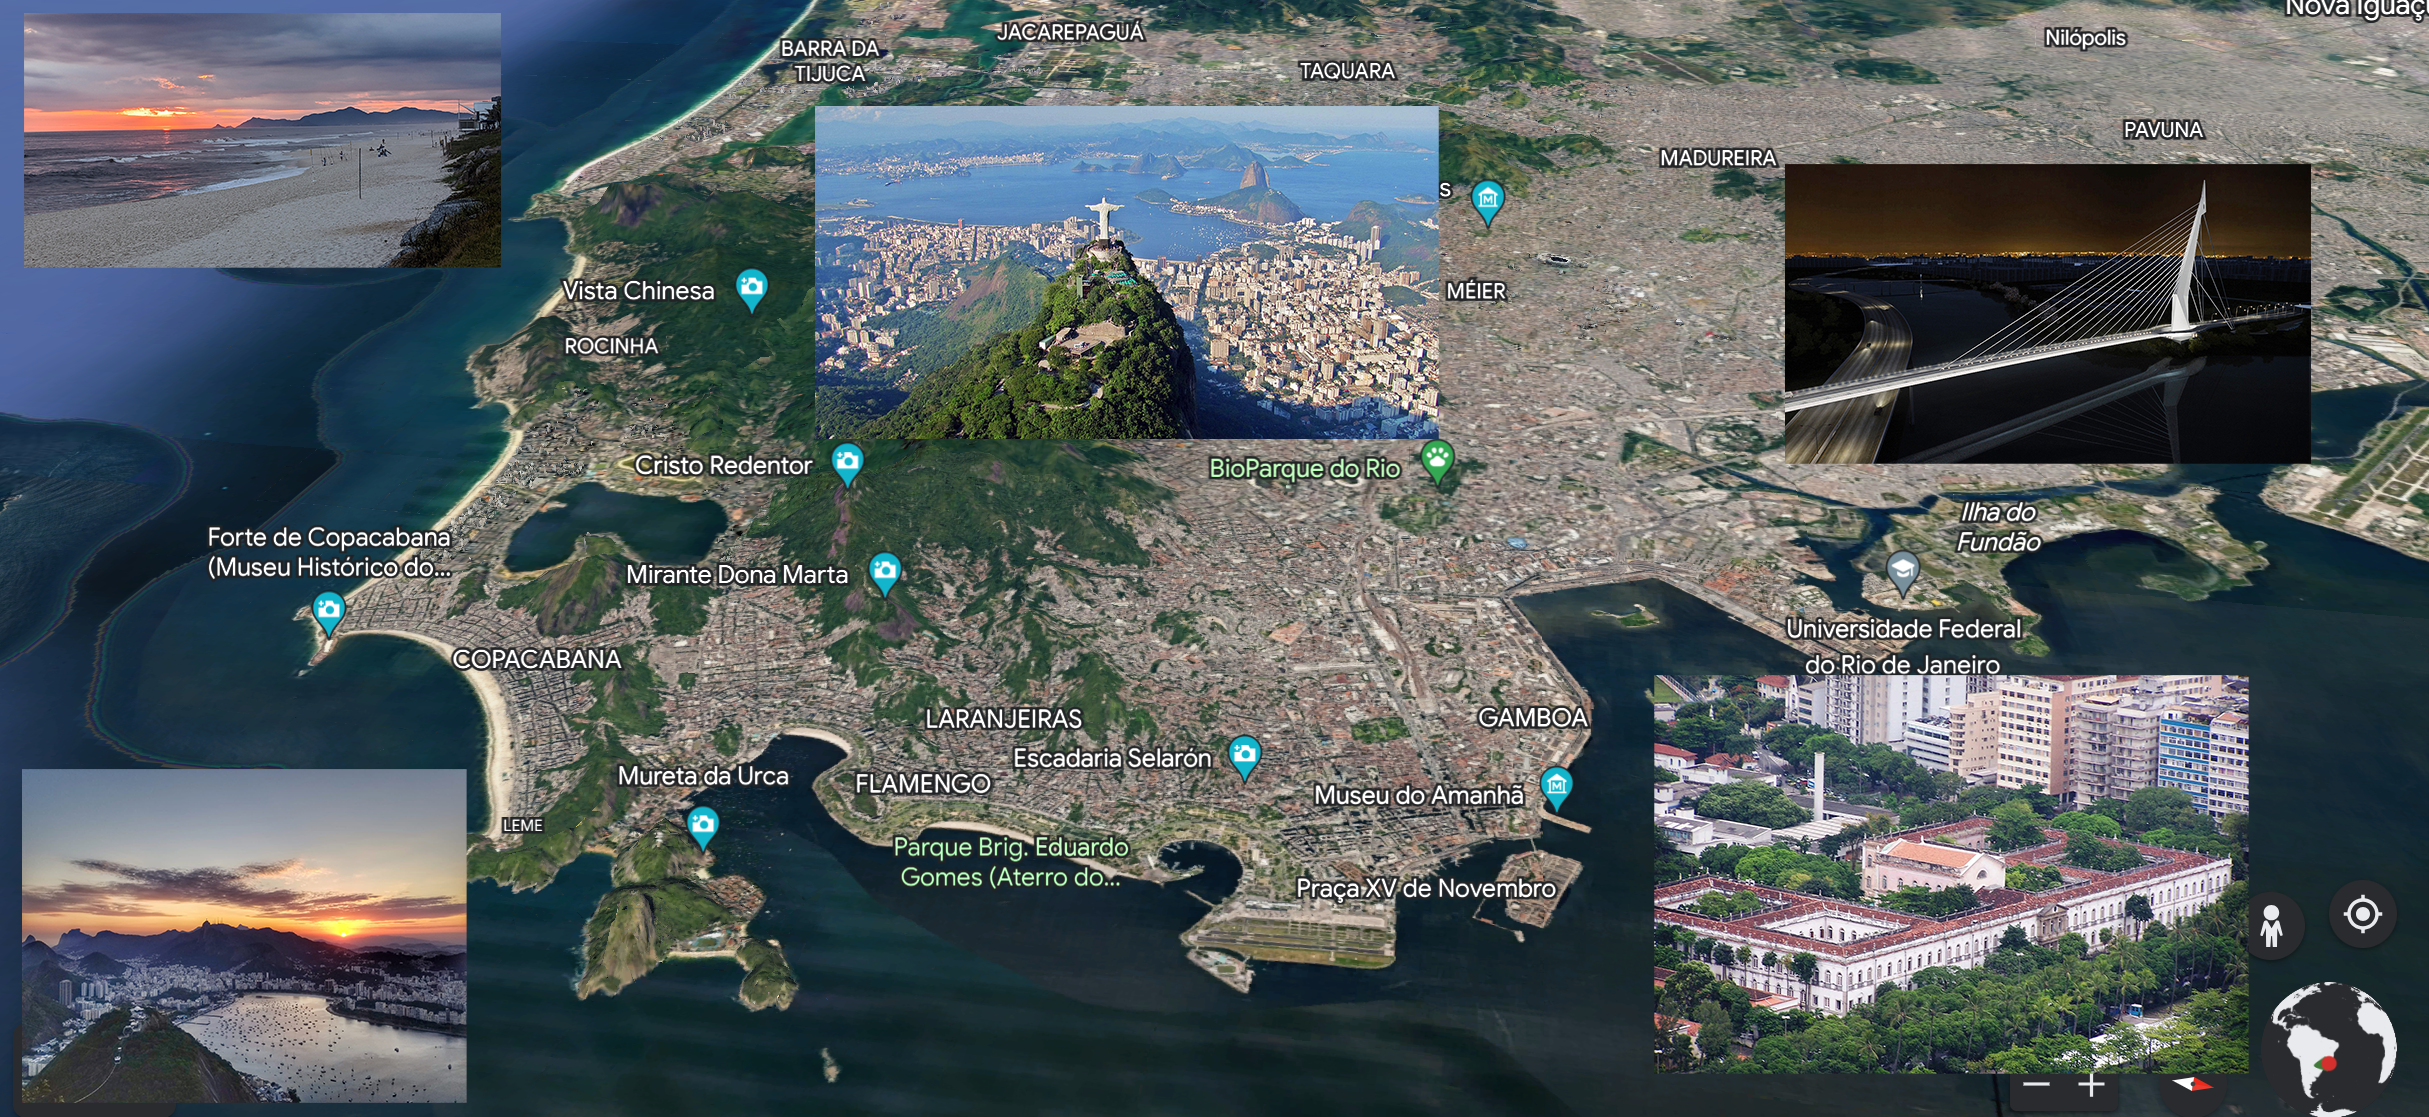
A Google Earth image of Rio de Janeiro. Photo insets, clockwise, from top left: 1) A sunset view of Barra da Tijuca beach courtesy of Augusto Getirana. 2) A photo, looking east, of the 30-meter, Art Deco Christ the Redeemer statue, built from 1922 to 1931. The distinctive Sugarloaf Mountain is seen in Guanabara Bay at upper right. Photo , CC BY-SA 3.0, via Wikimedia. 3) A view of the postmodern Ponte do Saber na Ilha da Universidade Federal do Rio de Janeiro, UFRJ (Bridge of Knowledge to the Island of the Federal University of Rio de Janeiro). Photo by Governo do Estado do Rio de Janeiro (Government of the State of Rio de Janeiro), CC BY 2.0 BR, via Wikimedia Commons. 4) The Palácio Universitário (University Palace), a 19th-century, neoclassical building that served as the old UFRJ campus. Photo by Fulviusbsas via Wikimedia. 5) A photo, looking west, taken from Sugarloaf Mountain in Guanabara Bay. In the foreground is the gondola stop on Morro de Uca hill. Photo courtesy of Augusto Getirana.
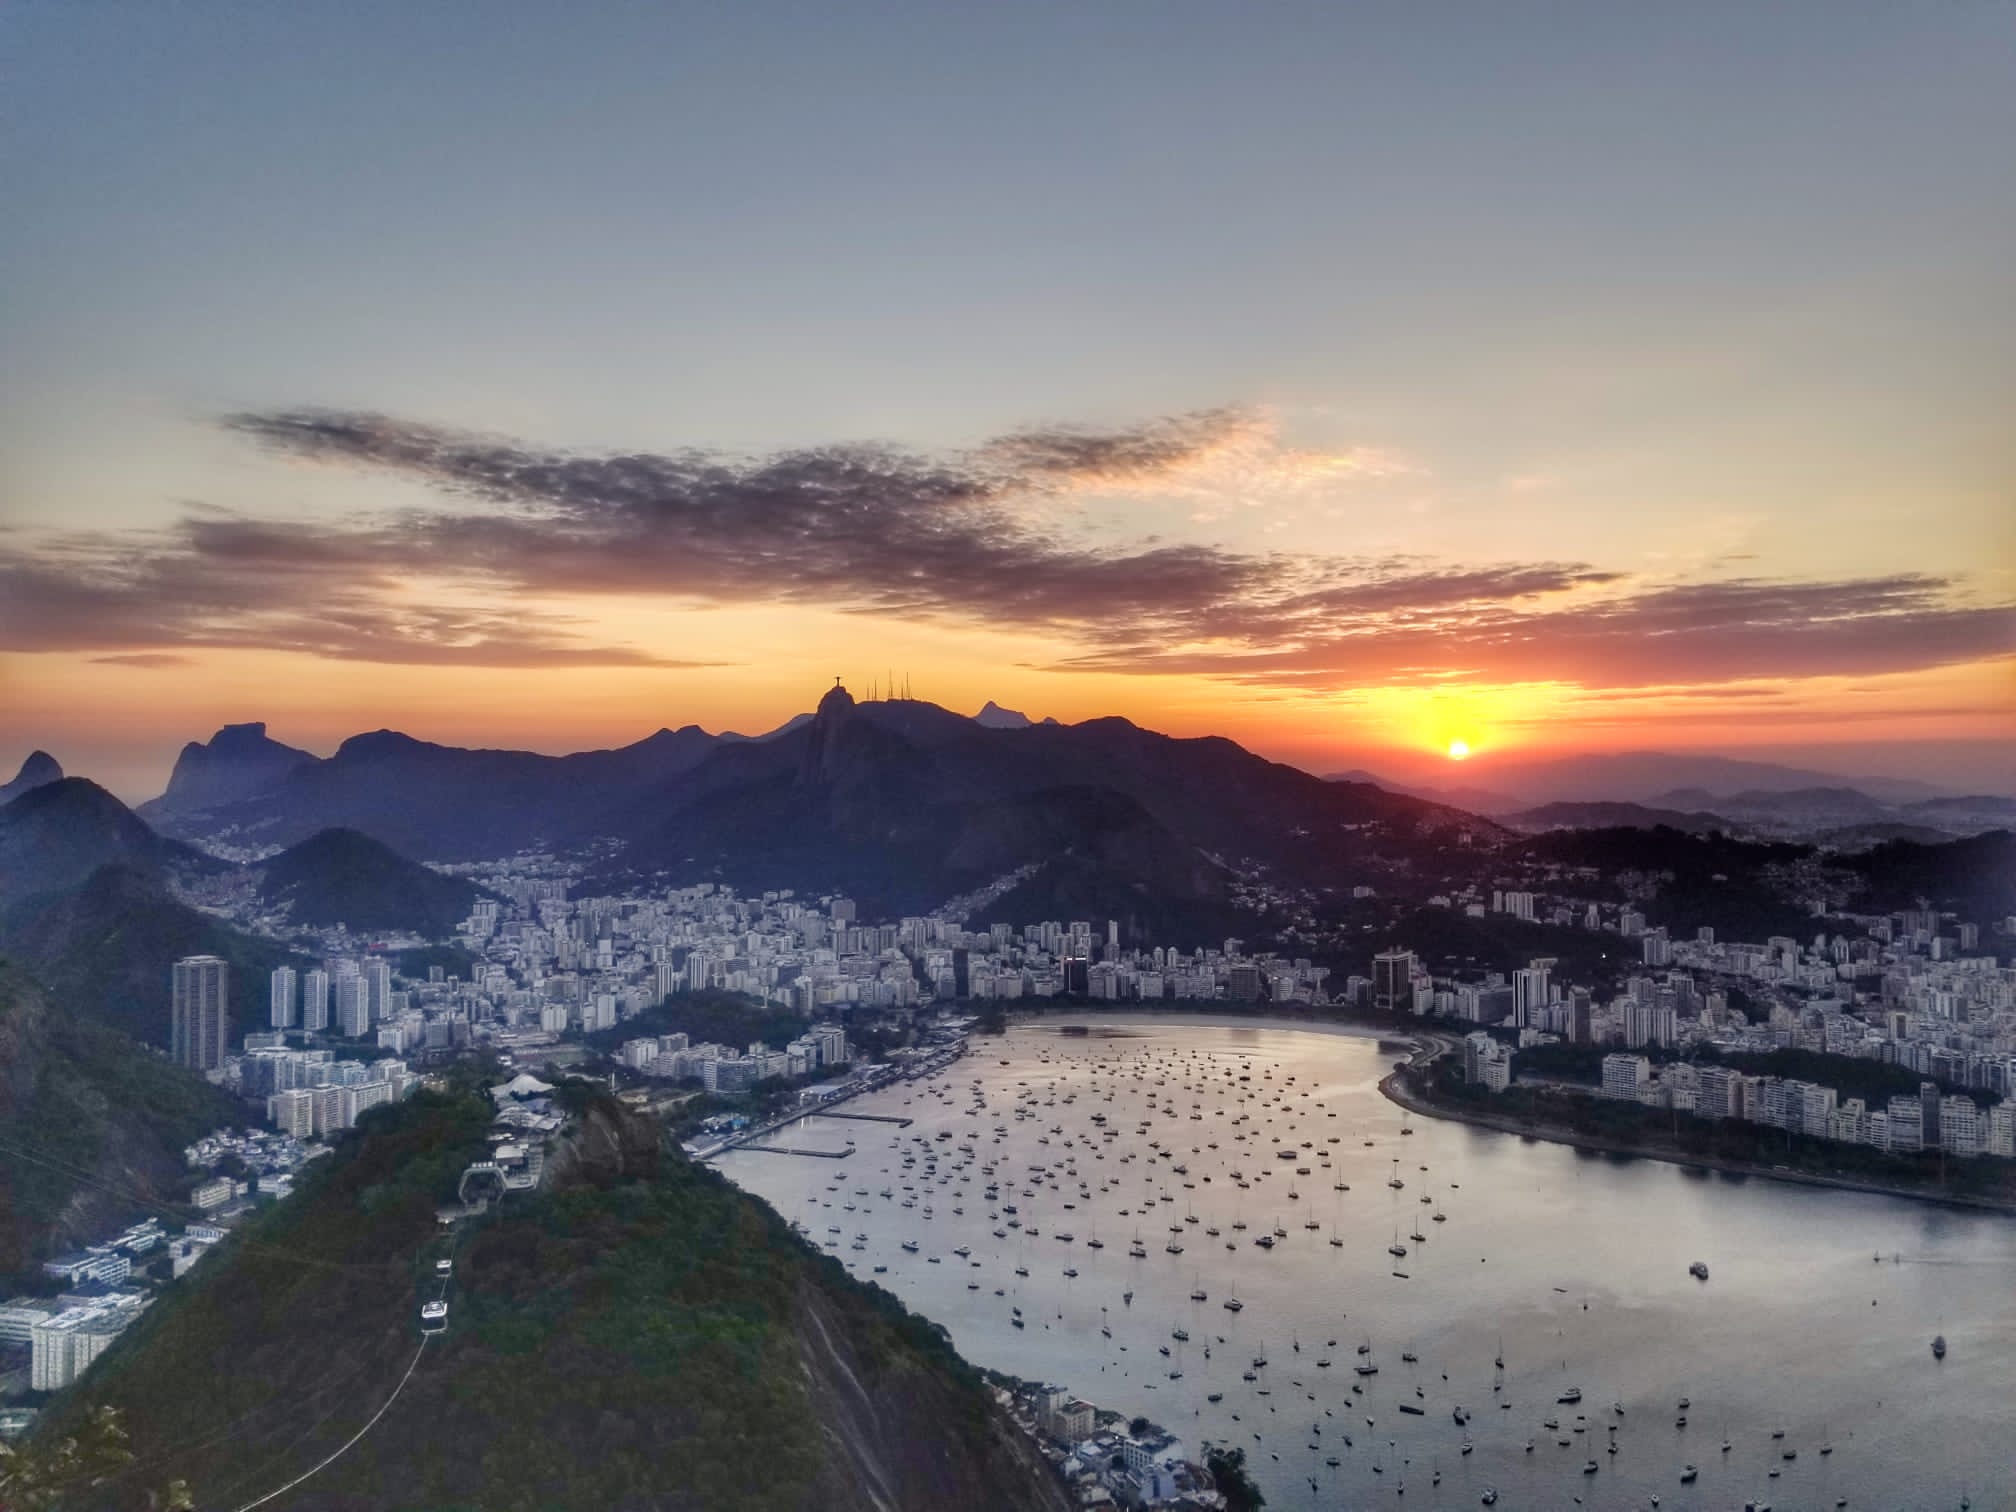
A photo, looking west, taken from Sugarloaf Mountain in Guanabara Bay. In the foreground is the gondola stop on Morro de Uca hill. Along the shaded silhouette of the distant mountain range is Pedra da Gávea on the left, and the statue of Christ the Redeemer in the far center. Photo courtesy of Augusto Getirana.
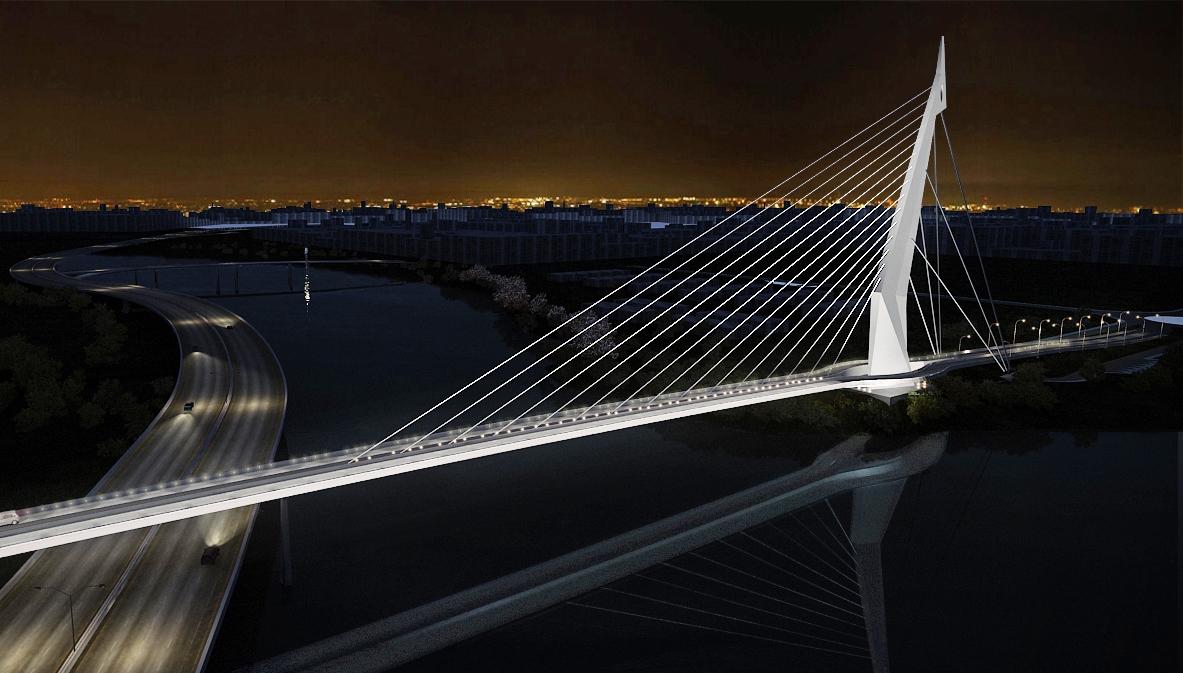
A view of the postmodern Ponte do Saber na Ilha da Universidade Federal do Rio de Janeiro, UFRJ (Bridge of Knowledge to the Island of the UFRJ. Photo by Governo do Estado do Rio de Janeiro (Government of the State of Rio de Janeiro), CC BY 2.0 BR, via Wikimedia Commons.
How did you end up getting your doctorate in Earth science, rather than in civil engineering? Luckily, I found my way into science at the very end of engineering school when I started a master’s program in water resources engineering at UFRJ in Rio. When I finished that degree, I moved to Toulouse, France, and earned my Ph.D. at Université Toulouse III (Paul Sabatier University), in the Toulouse Graduate School of Earth and Space Science (TESS). Even though I don’t work as an engineer anymore, my civil engineering background is an essential part of what I am today. Engineering school creates problem solvers, and I use these acquired problem-solving skills on a daily basis at NASA.
[Editor’s note: TESS states that the school “aims to train the next generation of scientists on the front-line dealing with the monitoring and management of global change. It draws its strength from one of the largest concentrations of people working in this field in Europe, a world-renowned talent hub.”]

The Toulouse Capitole building at night. The Neoclassical façade is made of pink brick and dates from 1750. Photo by Benh LIEU SONG, CC BY-SA 3.0, via Wikimedia.
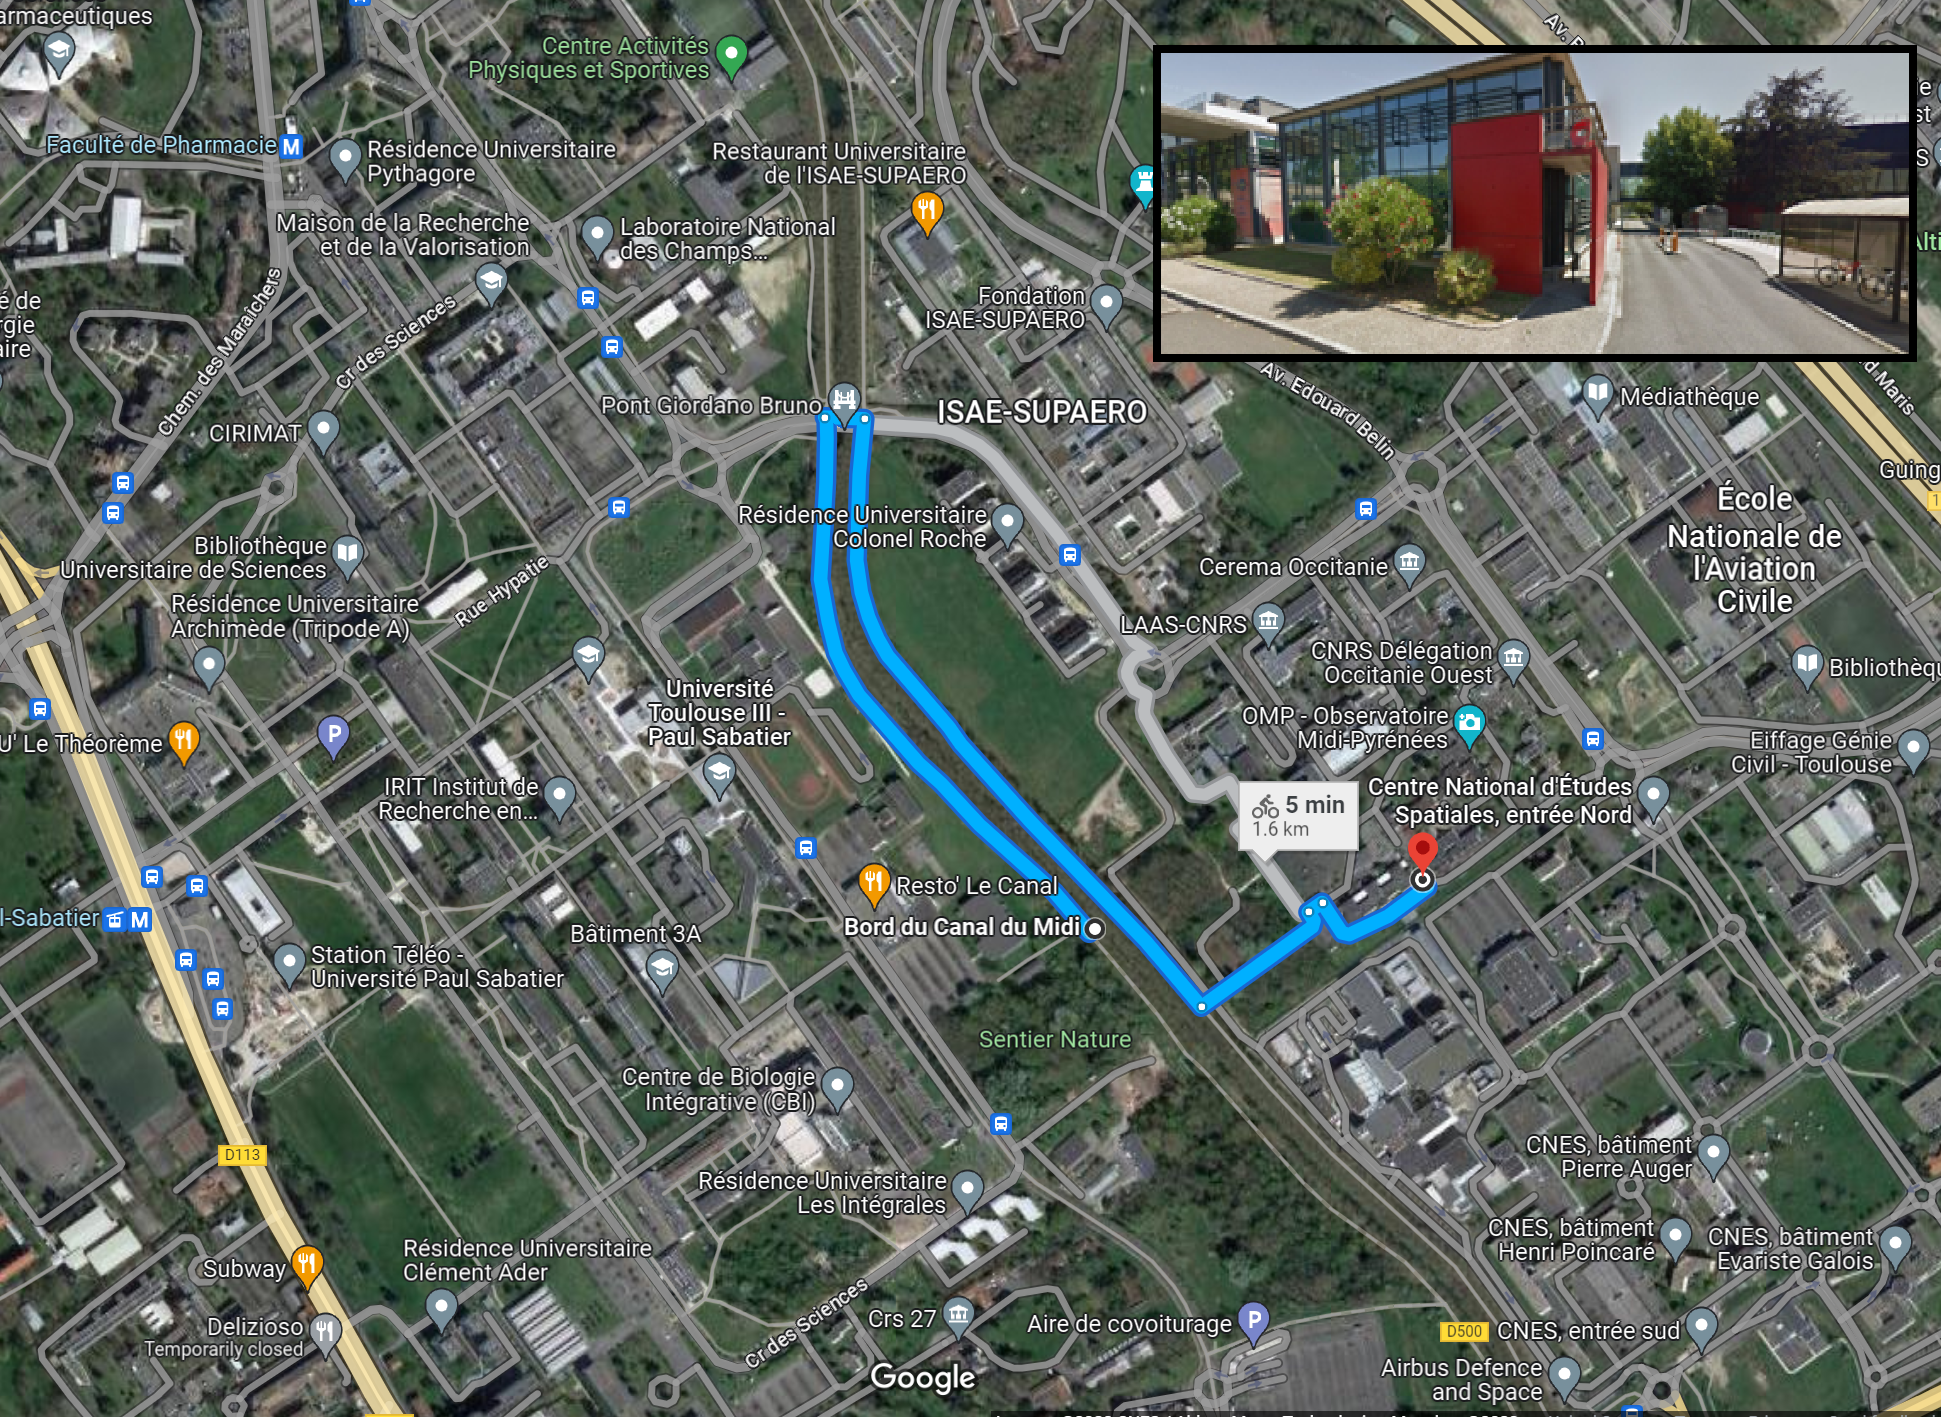
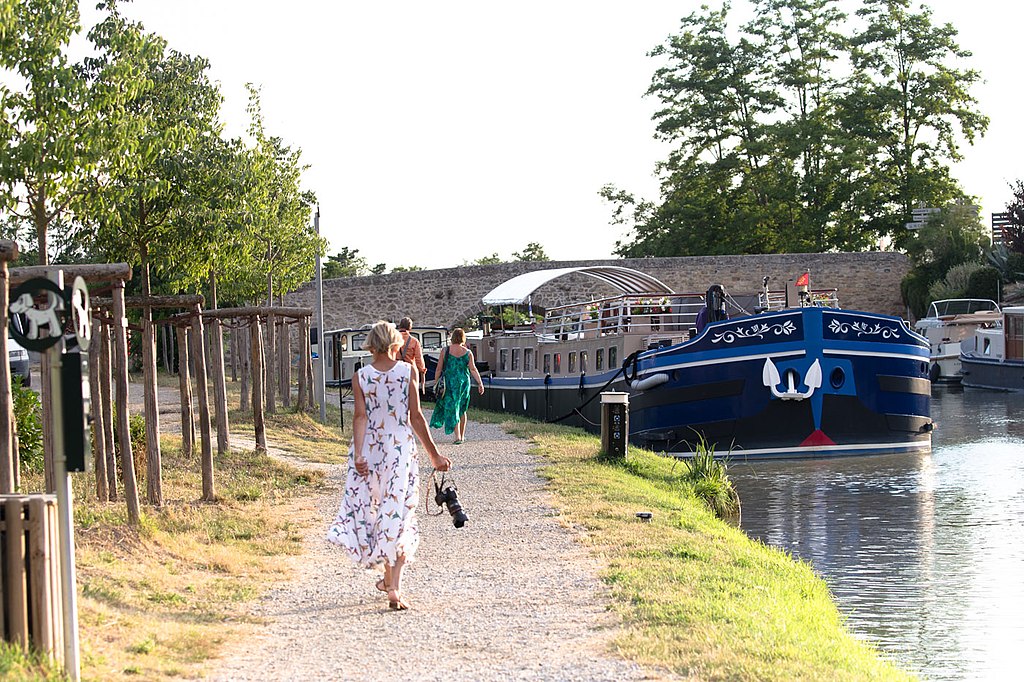
Above: A Google map of the complex in Toulouse near the laboratory where Getirana worked and the proximity to the walking path of the Canal du Midi. Inset: A photo from Google Street Map of the location of the TESS laboratories at Université Toulouse III, not far from a walking path along the famous Canal du Midi, where Getirana used to bike daily on his way to the lab.
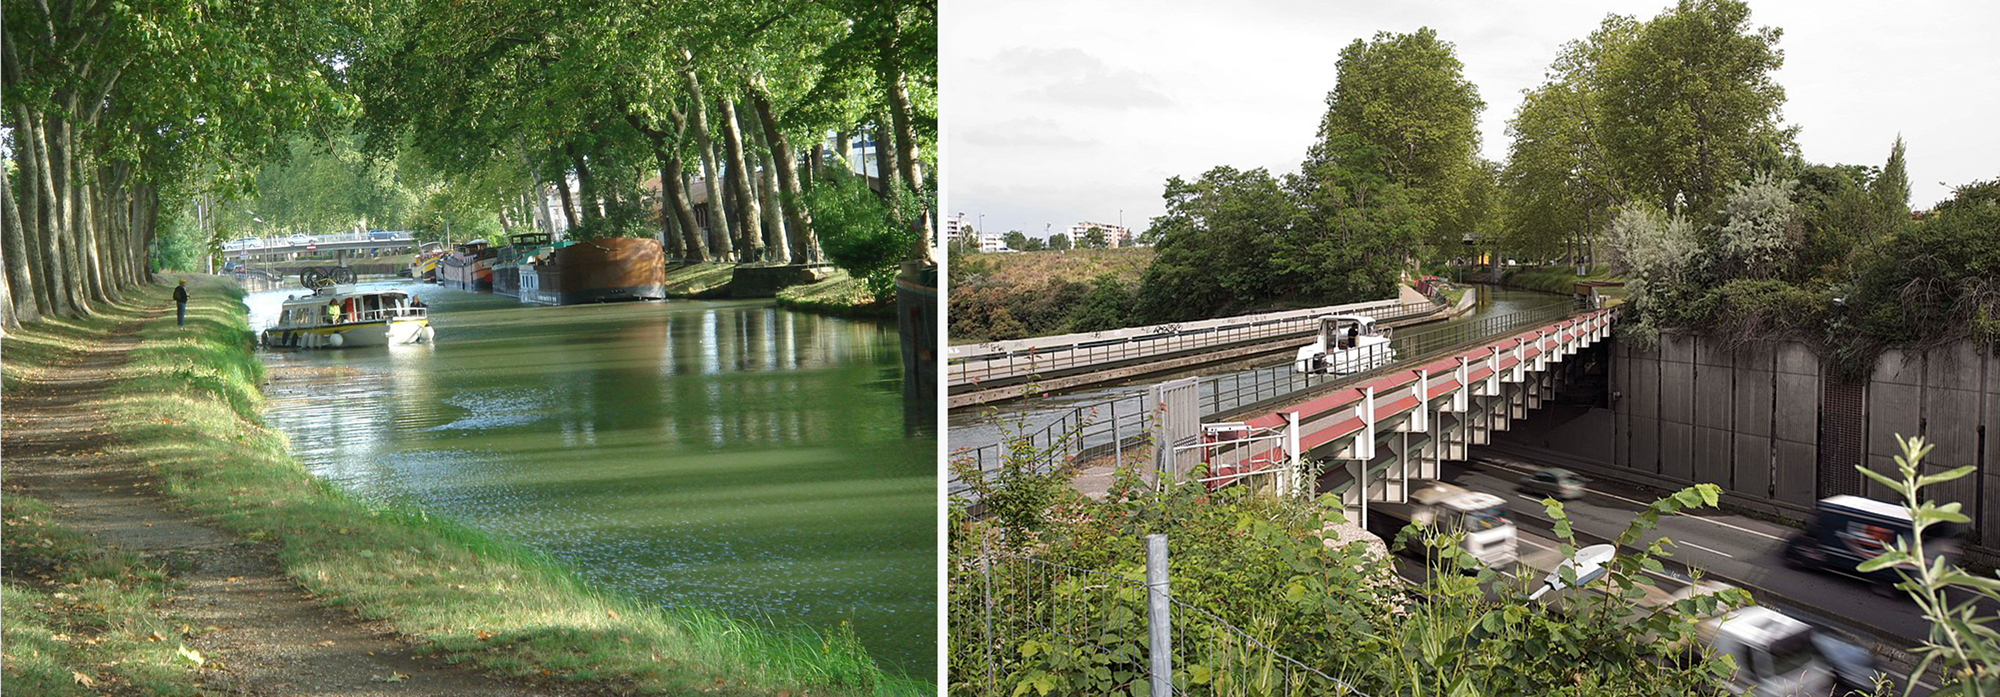
Left: A view of the Canal du Midi (Noon Canal) near the Pont des Demoiselles (Damsels Bridge) in Toulouse. Stone aqueducts on the Canal du Midi allow the canal to intersect and cross over natural streams. Photo by oeuvre personnelle, GNU FDL, via Wikimedia. Right: A view of the steel Herbettes canal bridge that flows over the Avenue du Saouzeloung in Toulouse. Photo by Stephanie Renard/City of Toulouse/Municipal Archives of Toulouse, CC BY-SA 2.0, via Wikimedia. Below: A view of one of the 240 kilometer long canal’s many aqueducts. Photo by Ragnhild & Neil Crawford, Sweden, CC BY-SA 2.0, via Wikimedia.
Do you enjoy your work at NASA? I love what I do, and I cannot imagine doing anything else. I don't even see what I do as work. I compare myself to a teenager playing video games – my work is just as much fun! I've been extremely lucky to work in a field (Earth science), at a place (NASA Goddard Space Flight Center), with a group that is constantly challenging me. I hope that my scientific contributions are helping the planet and generating new knowledge for humanity.
What is your current role at NASA? In a few words, my specialty is in surface water hydrology, and I focus on surface water modeling and remote sensing. I currently lead the surface water hydrology developments in the NASA Land Information System (LIS), the coastal flood risk studies in the NASA Earth Information System (EIS), such as the southern Louisiana studies and the NASA, Rio de Janeiro Extend Disaster Preparedness Partnership. I also contribute to a series of projects focusing on flood monitoring and forecast as well as human impacts on the water cycle across the globe.
Who inspires you? I've found professional inspiration at different periods of my career, depending on where I was and what I was doing, from my graduate studies to nowadays. As a student, I had professors that inspired me. Today, I find inspiration from a few NASA scientists that I’ve had the opportunity to work with. I also hope that my work will serve as inspiration to younger scientists in the future.
Are there any research experiences that have influenced your current work or your future plans? During my Ph.D., I worked on the use of radar altimetry data to improve the hydrological modeling of the Amazon basin. That certainly defined my professional path and what I work on today. After my Ph.D., I worked at Meteo-France, the French meteorological service, and for the Centre National d’Etudes Spatiales, the French Space Agency, which also opened new frontiers in my career and allowed me to be where I am today.
What is your greatest concern and greatest hope for the future of Earth/climate? My greatest concern is that humanity, at the political level, hasn't done enough in the past decades to fight climate change, and it's probably too late to prevent the worst. My greatest hope is that humanity, at the scientific level, has been doing exceptional work in trying to understand, identify, mitigate, adapt, and communicate issues that come with climate change.
What are the implications of your research, and are you/how are you getting these results out to water managers for risk mitigation? Most scientific work takes time to reach the decision-making process. Sometimes years. I have the privilege to work in a number of projects that deal directly with stakeholders, allowing me to see immediate impact. An example is EIS. One of the goals is to work with stakeholders to identify real world issues and develop tools and techniques using NASA capabilities to tackle them. All the science resulting from these efforts is made freely available for anyone to replicate or customize to their own applications.
RELATED LINKS
- Getirana, A., S. Kumar, G. Konapala, W. Nie, K. Locke, B. Loomis, C. Birkett, M. Ricko, and M. Simard, 2023: Climate and Human Impacts on Hydrological Processes and Flood Risk in Southern Louisiana. Water Resources Research, doi:10.1029/2022wr033238.
- Deluge in Louisiana, NASA Earth Observatory.
- GPM Sees Louisiana Floods, 2016, NASA Scientific Visualization Studio.
- NASA’s GPM Examines Exceptionally Heavy Louisiana Rainstorms, NASA.gov feature by Harold Pierce and Rob Gutro.
- August 2016 Record Flooding, National Weather Service.
Sean Keefe, NASA Goddard Space Flight Center
August 22, 2023