NCCS COLLABORATES WITH THE NSF SPATIOTEMPORAL INNOVATION CENTER AT GEORGE MASON UNIVERSITY – Part 2
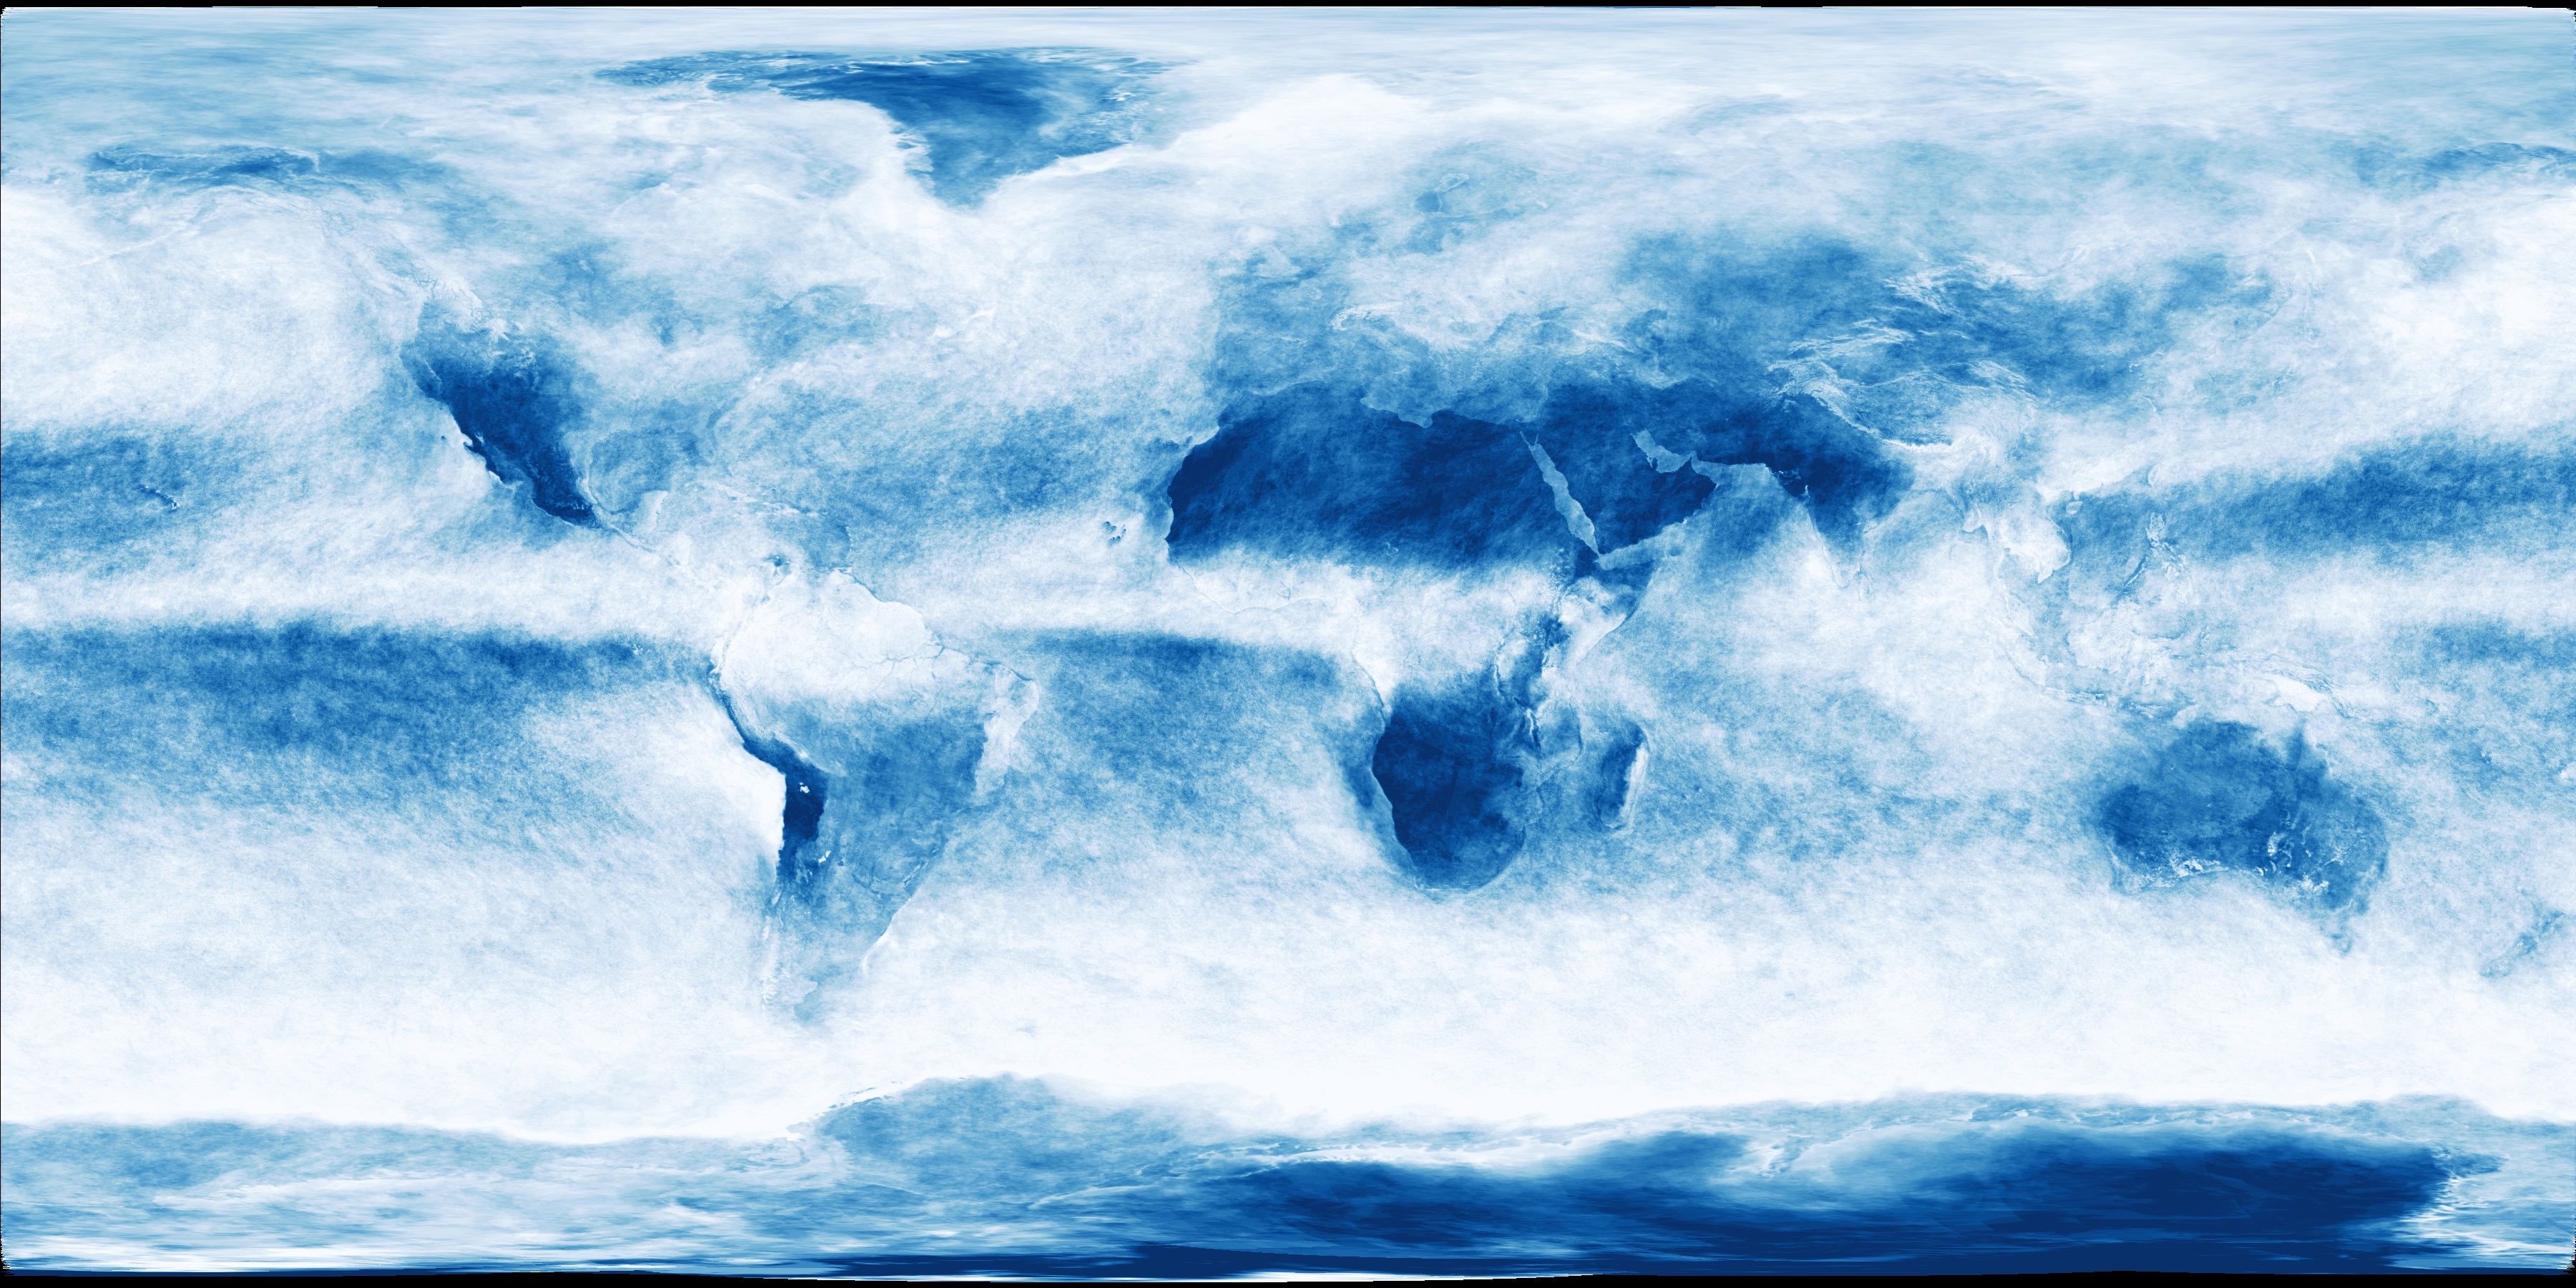
This cloud fraction map, made from NASA TERRA/MODIS satellite observations, reveals how much of Earth's surface is covered by clouds over a span of one month. Imagery by Reto Stöckli, NASA's Earth Observatory, using data provided by the MODIS S-NPP Atmosphere Science Team, NASA Goddard Space Flight Center.
The NASA Center for Climate Simulation (NCCS) is a member and sponsor of the NSF Spatiotemporal Innovation Center (STC) at George Mason University (GMU), a collaborative research center spearheaded by Director Phil Yang. Under the National Science Foundation (NSF) Industry-University Cooperative Research Center (I/UCRC) program, GMU is one of two sites within the STC, with the other site located at Harvard University. The NSF provided support and seed funding for the STC.
Yang has formed official partnerships between the STC at GMU and its member organizations including the NCCS, other governmental entities, and private sector companies such as RMDS Lab. The NCCS and other STC members provide funds, data, computational resources, ideas, and expertise to support a variety of collaborative research projects. This seven-year NCCS/STC partnership has resulted in collaboration on many innovative machine learning (ML) research projects that include the Climate Data Downscaling Project, featured in a recent NCCS news highlight, and the Cloud Classification Project, summarized here, which promises more accurate, real-time detection of rainy clouds through a new deep learning method. NASA Goddard’s Dan Duffy and Bill Putman worked as advisors on this project with Phil Yang and Qian Liu from the GMU STC.
Cloud Classification Project
Clouds exert a significant influence on the characteristics and dynamics of global climate, weather, and natural disasters. They are also an important regulator of climate and are directly related to the Earth’s energy balance and to atmospheric phenomena such as precipitation. Thus, cloud classification that integrates spatiotemporal methodologies is a crucial parameter of climate models and numerical weather prediction (NWP), which is why the NCCS and the STC have been collaborating since 2019 on the Cloud Classification Project.
The goal of this project is to classify clouds based on their potential to produce precipitation and their forms, positions, and other features. The project entails using continuous satellite images from six different sensors, cloud-related reanalysis variables, cloud properties data, and a deep neural network (DNN) method—a type of ML method based on artificial neural networks with representation (feature) learning. The project tests various methods and will ultimately develop an effective and operational system of classifying clouds into distinct categories.
| Sensor | Product | Coverage | Temporal Resolution | Spatial Resolution | Spectral Resolution | Role |
|---|---|---|---|---|---|---|
| Aqua/Terra-MODIS | Level 1 | Global | Twice a day | 250 m, 500 m, 1 km | 36 bands | Spectral predictor |
| GOES 16-ABI | ABI level 1 data | CONUS, North and South America | CONUS-5 min, Full disc-15 min | 0.5 km (VS); 1 km (VS-NIR); 2 km (VIS) | 16 bands | Spectral predictor |
| GOES 17-ABI | ABI level 1 data | CONUS, North and South America | CONUS-5 min, Full disc-15 min | 0.5 km (VS); 1 km (VS-NIR); 2 km (VIS) | 16 bands | Spectral predictor |
| HIMAWARI 8/9-AHI | AHI level 1 data | Japan, Full disc: Asia, Australia | Japan-2.5 min, Full disc-10 min | 0.5 km (VS); 1 km (VS-NIR); 2 km (VIS) | 16 bands | Spectral predictor |
| METEOSAT -SEVIRI | SEVIRI level 1 data | Global | Twice a day | 1 km (high-resolution VS); 3 km (others) | 12 bands | Spectral predictor |
| VIIRS | Level 1 | Global | Twice a day | 375 m, 750 m | 22 bands | Spectral predictor |
The six sensors used to extract cloud data in the Cloud Classification Project.
Table from Qian Liu, Spatiotemporal Innovation Center, George Mason University
The project team studied the coastal region of several Mid-Atlantic states with a wet climate, providing abundant stratiform and convective precipitation samples to use for training and testing and for building cloud classification models. Researchers are investigating how to classify clouds into eight categories, in collaboration with the NASA Langley Distributed Active Archive Center. Researchers used a DNN method to classify rainy and non-rainy clouds based on the brightness temperature differences (BTDs) and reflectances (Ref) derived from the new Advanced Baseline Imager (ABI) onboard the GOES-16 satellite. The ABI instrument provides a precipitation product that monitors precipitation levels in real time and with higher spatiotemporal and spectral resolutions, especially during daylight hours.
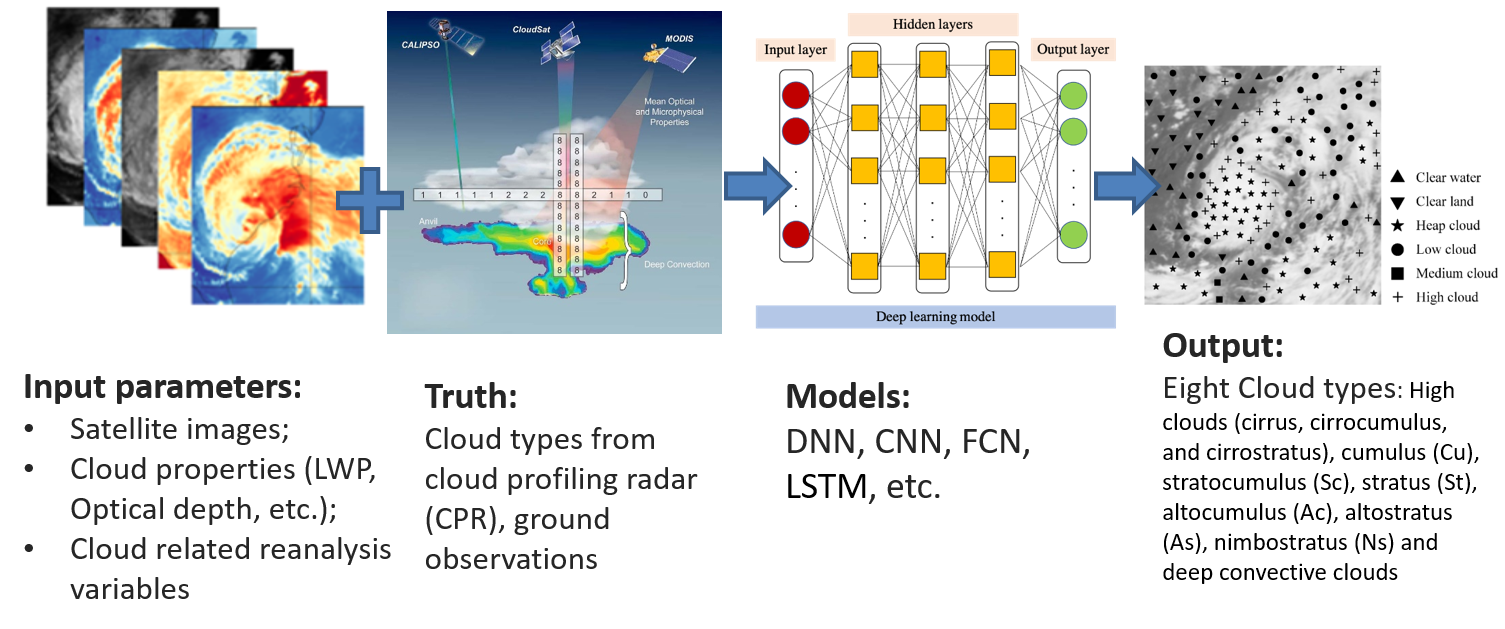
This graphic depicts the flow of data and process in this project, from input to output. Figures from Qian Liu, GMU STC.
The main steps of the process were to input satellite images, cloud properties including liquid water path and optical depth, and cloud-related reanalysis variables including mass fraction of cloud ice/liquid water and relative humidity. Next, the researchers validated the data through “ground truth” methods, comparing cloud types from cloud profiling radar (CPR) and ground observations. The precipitation events used for training and validation were obtained from the IMERG V05B data, covering the southeastern coast of the U.S. during the 2018 rainy season.
Various models were then tested, and that data was output into eight cloud types: 1) high clouds—cirrus, cirrocumulus, and cirrostratus; 2) cumulus; 3) stratocumulus; 4) stratus; 5) altocumulus; 6) altostratus; 7) nimbostratus; and 8) deep convective clouds.
The researchers wanted to test the feasibility of artificial intelligence (AI) methods in natural phenomena detection and segmentation as well as validate the performance of the rainy cloud model on testing data. They began by comparing the DNN to traditional ML methods, including support vector machines (SVMs) and random forest (RF). As illustrated in the table below, the DNN outperformed traditional ML methods for rainy cloud detection and had the highest accuracy in each of the assessors. The ideal numbers for each measurement are listed at the top of each column in the table, and the best result for each assessor is shown in bold.
| Model | POD (ideal: 1) |
POFD (ideal: 0) |
FAR (ideal: 0) |
Bias (ideal: 1) |
CSI (ideal: 1) |
MA (ideal: 1) |
|---|---|---|---|---|---|---|
| DNN | 0.86 | 0.13 | 0.2 | 1.07 | 0.71 | 0.87 |
| SVM | 0.85 | 0.13 | 0.21 | 1.07 | 0.69 | 0.86 |
| RF | 0.85 | 0.14 | 0.21 | 1.09 | 0.7 | 0.86 |
Validation of rainy cloud detection model on testing data. Assessor key: Probability of Detection (POD); Probability of False Detection (POFD); False Alarm Ratio (FAR); Critical Success Index (CSI); Model Accuracy (MA); Deep Neural Network (DNN); Support Vector Machine (SVM); Random Forest (RF). Table from Qian Liu, GMU STC.
To validate the performance of the convective precipitation delineation model on testing data, the DNN was again compared to several traditional ML methods. As illustrated in the table below, the DNN outperformed traditional machine learning methods for convective precipitation delineation for almost all the assessors except Probability of Detection (POD). Only the DNN model did not overestimate the convective areas. The ideal numbers for each measurement are listed at the top of each column in the table, and the best result for each assessor is shown in bold.
| Model | POD (ideal: 1) |
POFD (ideal: 0) |
FAR (ideal: 0) |
Bias (ideal: 1) |
CSI (ideal: 1) |
MA (ideal: 1) |
|---|---|---|---|---|---|---|
| DNN | 0.72 | 0.23 | 0.24 | 0.94 | 0.58 | 0.74 |
| SVM | 0.86 | 0.4 | 0.44 | 1.55 | 0.51 | 0.69 |
| RF | 0.78 | 0.35 | 0.43 | 1.37 | 0.49 | 0.7 |
For convective precipitation delineation, the advantage of DNN is even more evident, but all models overestimated the convective areas, except the DNN model. The DNN achieves the highest accuracy for almost all the assessors except POD (0.72 vs. 0.86 and 0.78). The DNN performed much better than RF and SVM, with a 0.20 lower FAR and 0.07–0.09 higher CSI. Table from Qian Liu, GMU STC.
To compare the performance of the DNN classification system to IMERG estimations, two case studies were used—a normal precipitation event and an extreme precipitation event. The figure below shows the DNN prediction (left) and the IMERG estimation (right) for a normal precipitation event on July 9, 2018. The spatial distribution patterns of both systems are consistent. The DNN classification system accurately detects the rainy and convective area but slightly overestimates both, possibly due to insufficient samples used in the training dataset and temporal differences in IMERG estimates and ABI predictions. The researchers use arbitrary thresholds to determine rain clouds, which may introduce biases in the comparisons. With an increase in the number of ABI data samples used in the training dataset, these results could be further improved.
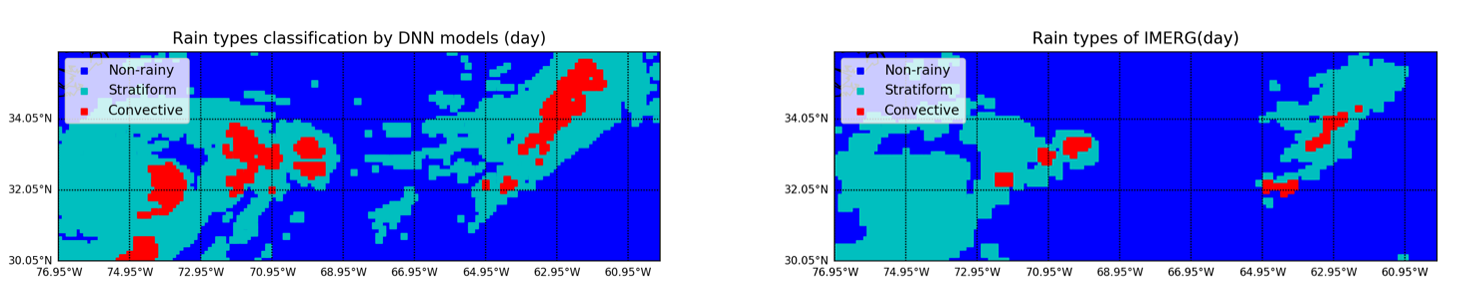
Cloud classification results and IMERG estimations on normal precipitation: (left) ABI Prediction and (right) IMERG estimation. Figures from Qian Liu, GMU STC.
The figure below shows the DNN prediction (left) and the IMERG estimation (right) for an extreme precipitation event, Hurricane Florence, on September 19, 2018. The spatial distribution patterns (shape and area of influence) of both systems are consistent. The DNN classification system accurately detected—albeit slightly overestimated—most of the convective areas over the ocean. It missed some small convective areas over land, possibly due to these factors: 1) most of the samples used to train the models involved normal precipitation because there were insufficient extreme weather samples, and 2) land vs. ocean precipitation modeling involves more complex factors, such as topography and vegetation.
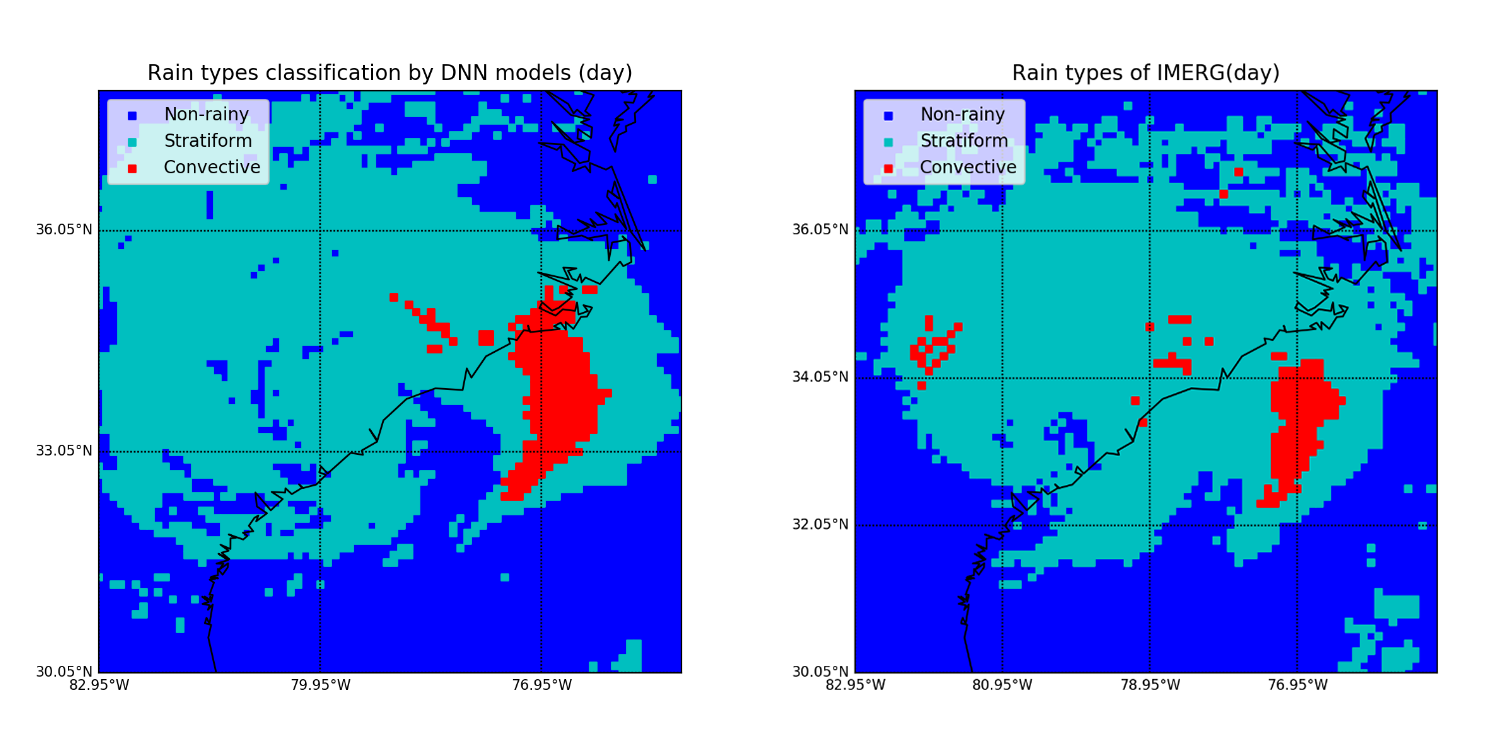
Cloud classification results and IMERG estimations on extreme precipitation (Hurricane Florence, September 19, 2018): (left) ABI Prediction; and (right) IMERG estimation. Figures from Qian Liu, GMU STC.
With more ABI data accumulation used for training datasets, this automatic cloud classification system could be deployed for extreme rainfall event detection, real-time forecasting, and decision-making support in rainfall-related disasters.
Within the validation process, researchers found that this DNN model returned better accuracies than traditional ML methods. DNN did particularly well with convective precipitation delineation for normal and extreme events. It performed better over ocean than land, with a trend in overestimating precipitation worldwide.
This project reveals the advantages of using AI with modeling atmospheric phenomena, and the critical steps developed can be used to further estimate precipitation rates in real time.
“As illustrated in this cloud classification project, spatiotemporal computing sets the foundation for many high-end computing applications such as climate, weather, and other Earth and space sciences.” Phil Yang observed. “As Dan Duffy shared from the very first day we established the NSF Spatiotemporal Center back in 2013, it is critical to both develop innovative technologies and train a new workforce in this important field.”
Related Link
Qian Liu, Y. Li, M. Yu, L.S. Chiu, X. Hao, D.Q. Duffy, and C. Yang, 2019: Daytime Rainy Cloud Detection and Convective Precipitation Delineation Based on a Deep Neural Network Method Using GOES-16 ABI Images. Remote Sens., 11, 2555, doi:10.3390/rs11212555.
Sean Keefe, NASA Goddard Space Flight Center