NCCS-Hosted Analysis Sheds
New Light on Mercury’s South Pole
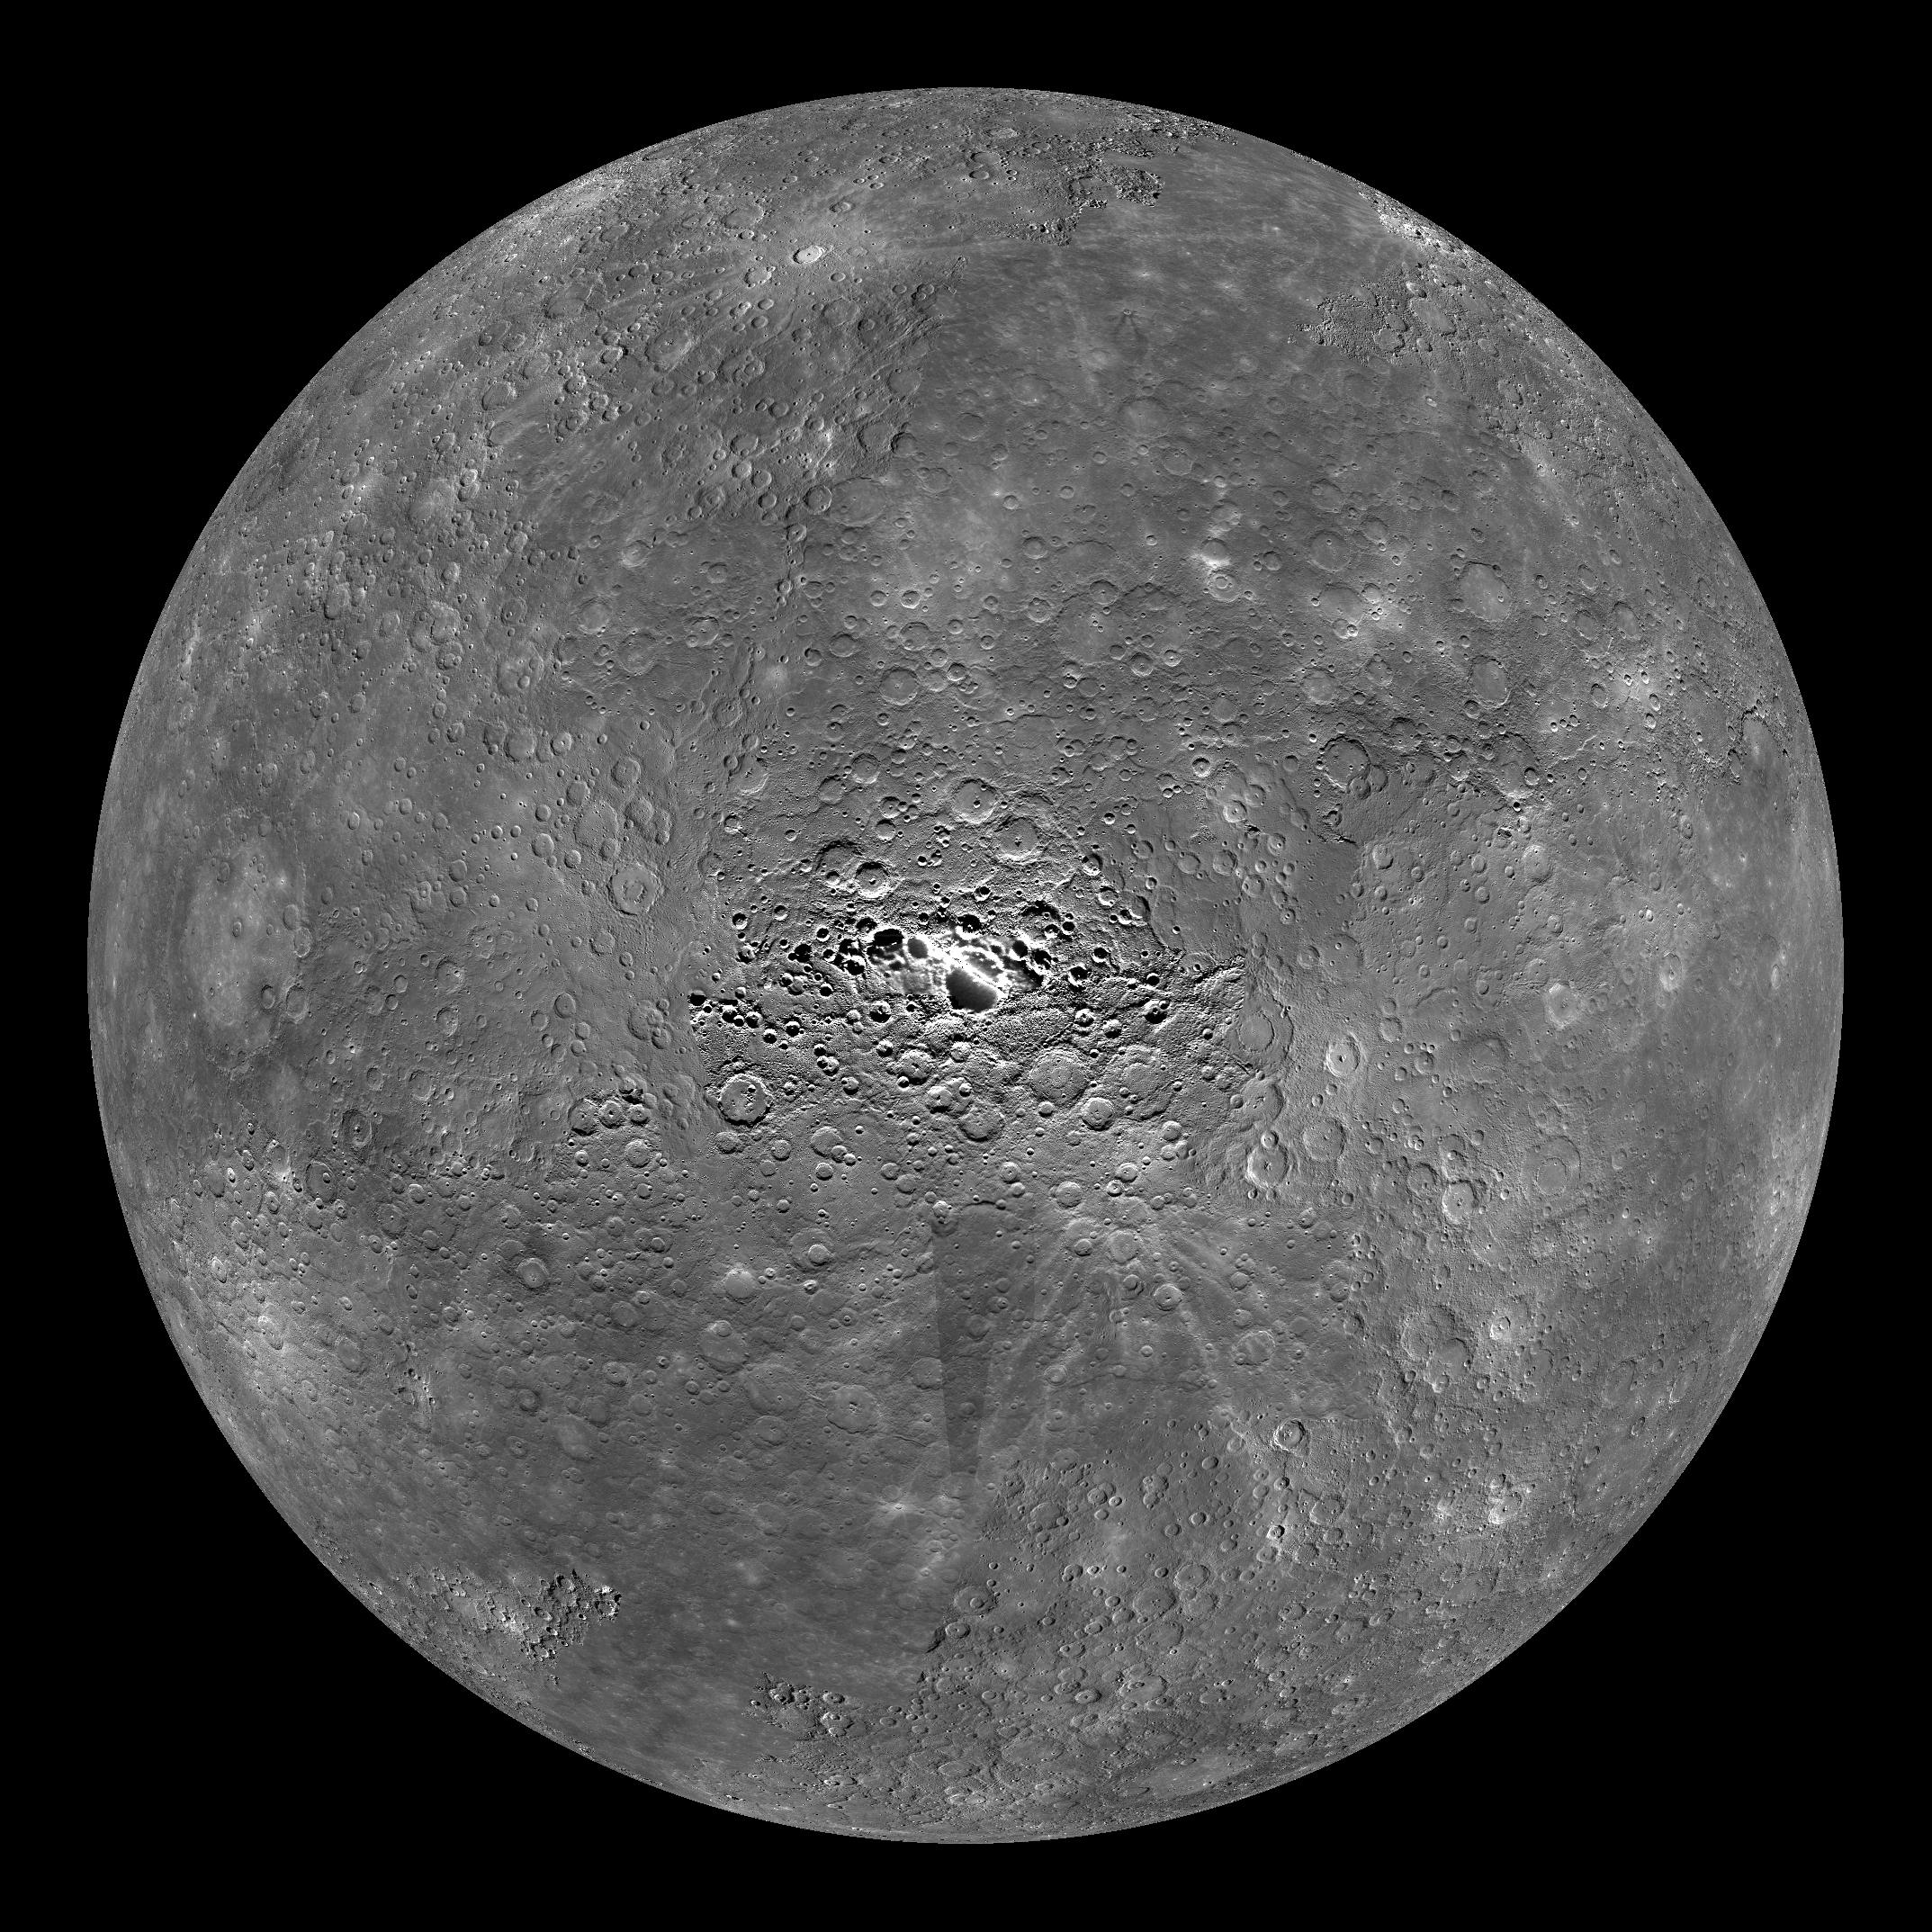
Mercury’s south pole (center), as captured in a global mosaic of images from the NASA MESSENGER spacecraft’s Mercury Dual Imaging System. A new NASA Goddard Space Flight Center study maps Mercury’s south pole region in greater detail than ever before. Image mosaic by NASA/Johns Hopkins University Applied Physics Laboratory/Carnegie Institution of Washington.
With Mercury being the closest planet to our Sun, it may surprise you to learn that water ice likely lurks in its shadowed polar craters.

Stefano Bertone
“The presence of water ice at Mercury’s poles was first suggested by Earth-based radar observations from the Arecibo observatory and then confirmed by NASA’s MESSENGER spacecraft,” said Stefano Bertone, an Assistant Research Scientist with NASA Goddard Space Flight Center’s Planetary Geology, Geophysics, and Geochemistry Laboratory. “While the north polar areas have been thoroughly studied in terms of their topography, illumination, and thermal environment, few studies have targeted Mercury’s south pole, mostly because of insufficiently accurate topography models.”
Harnessing MESSENGER spacecraft data and NASA Center for Climate Simulation (NCCS) cloud computing resources, Bertone led a study with scientists from NASA Goddard, the Johns Hopkins University Applied Physics Laboratory, the Planetary Science Institute, and several universities to create the first high-resolution topographic map of Mercury’s south pole. Their study appears in The Planetary Science Journal.
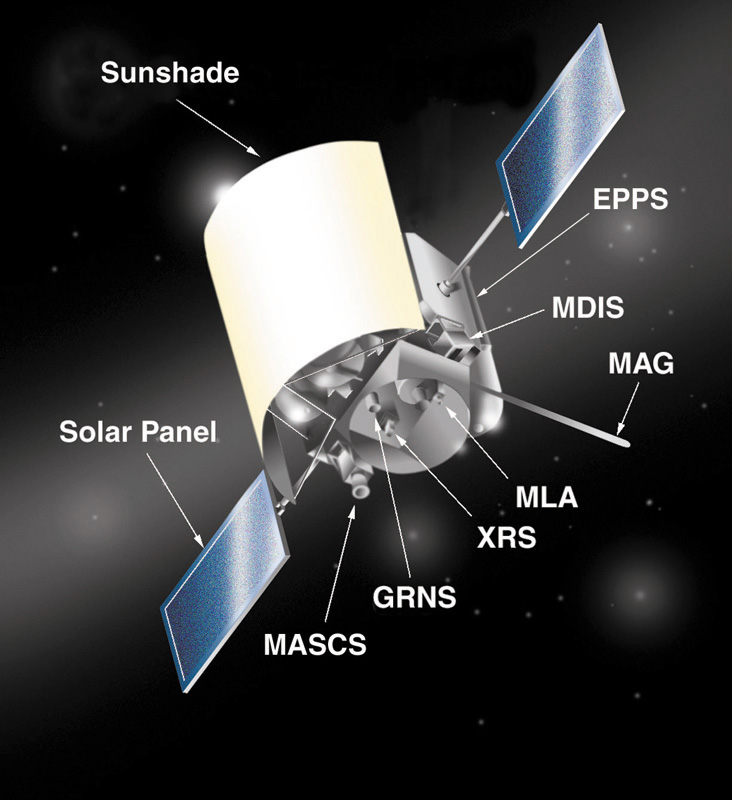
Bertone has been studying Mercury over the last 5 years. His previous research focused mostly on the north polar regions, where MESSENGER’s Mercury Laser Altimeter (MLA) instrument yielded accurate topography models at 250 meter-per-pixel resolution. “Because of MESSENGER’s elliptical orbit, no laser altimetry was available over Mercury’s southern hemisphere,” Bertone said. Instead, he and his collaborators turned to images from MESSENGER’s Mercury Dual Imaging System-Narrow Angle Camera (MDIS-NAC), identified in the image below.
Compared to using a laser altimeter, it is significantly more challenging to obtain high-resolution topographic information from the MDIS-NAC instrument. For this task, the scientists applied the Shape-from-Shading (SfS) technique as implemented in the NASA Ames Stereo Pipeline (ASP) software. SfS takes as input both camera images and a digital elevation model (DEM) computationally interpolated to be roughly the same resolution as the images and returns as output a refined DEM — essentially a topographic map enhanced by the terrain information in the images.
“While SfS is a powerful technique, it is quite sensitive to the chosen selection of images and to their relative and absolute alignment, which are very tricky aspects on which one needs to focus and spend considerable time in order to get a reliable science-enabling product,” Bertone noted.
Out of 270,000 MDIS-NAC images stored in the NASA Planetary Data System (PDS), Bertone and collaborators selected 1,300 images covering an area of 1.3 million square kilometers. For the input DEM they chose a United States Geological Survey (USGS) DEM developed by Kris Becker and colleagues.
Mercury is the closest planet to the Sun, with an average orbit distance of 57,909,226 kilometers (35,983,125 miles). By comparison, Earth orbits the Sun at an average distance of 149,598,261 kilometers (92,956,050 miles). Visualization by NASA's Scientific Visualization Studio (Tom Bridgman, visualizer; Joy Ng, producer).
The MDIS-NAC images and USGS DEM passed through a five-step processing and analysis pipeline — with SfS processing at the center — running on the NCCS Explore/ADAPT Science Cloud. To ease processing, the scientists divided the MDIS-NAC images into 200-kilometer “tiles,” with 25 tiles in total. A 10-CPU Explore/ADAPT node completed the pipeline for each tile in 24–36 hours.
“Having access to NASA supercomputing resources sped up the computation of our Mercury terrain models by a factor of 10 or more,” Bertone said. “Availability of multiple nodes with sufficient memory and disk space enabled us to store intermediate products as well as run multiple experiments, yielding an improved reliability of the final products.”
Impact: The increased resolution and detail in the new topographic map represent a key step for advancing knowledge of potential water ice and other volatiles in Mercury’s south polar region, contributing to our global understanding of their origin and evolution.
The resulting 250 meter-per-pixel resolution DEM matches results for Mercury’s north pole. Moreover, it resolves terrain features 5½ times smaller than previous south pole maps and enables several firsts for the region:
- Detailed modeling of varying Sun illumination and thermal conditions.
- Putting constraints on water ice and other volatiles that may reside there.
- Locating potential Permanently Shadowed Regions where water ice is more likely to exist.
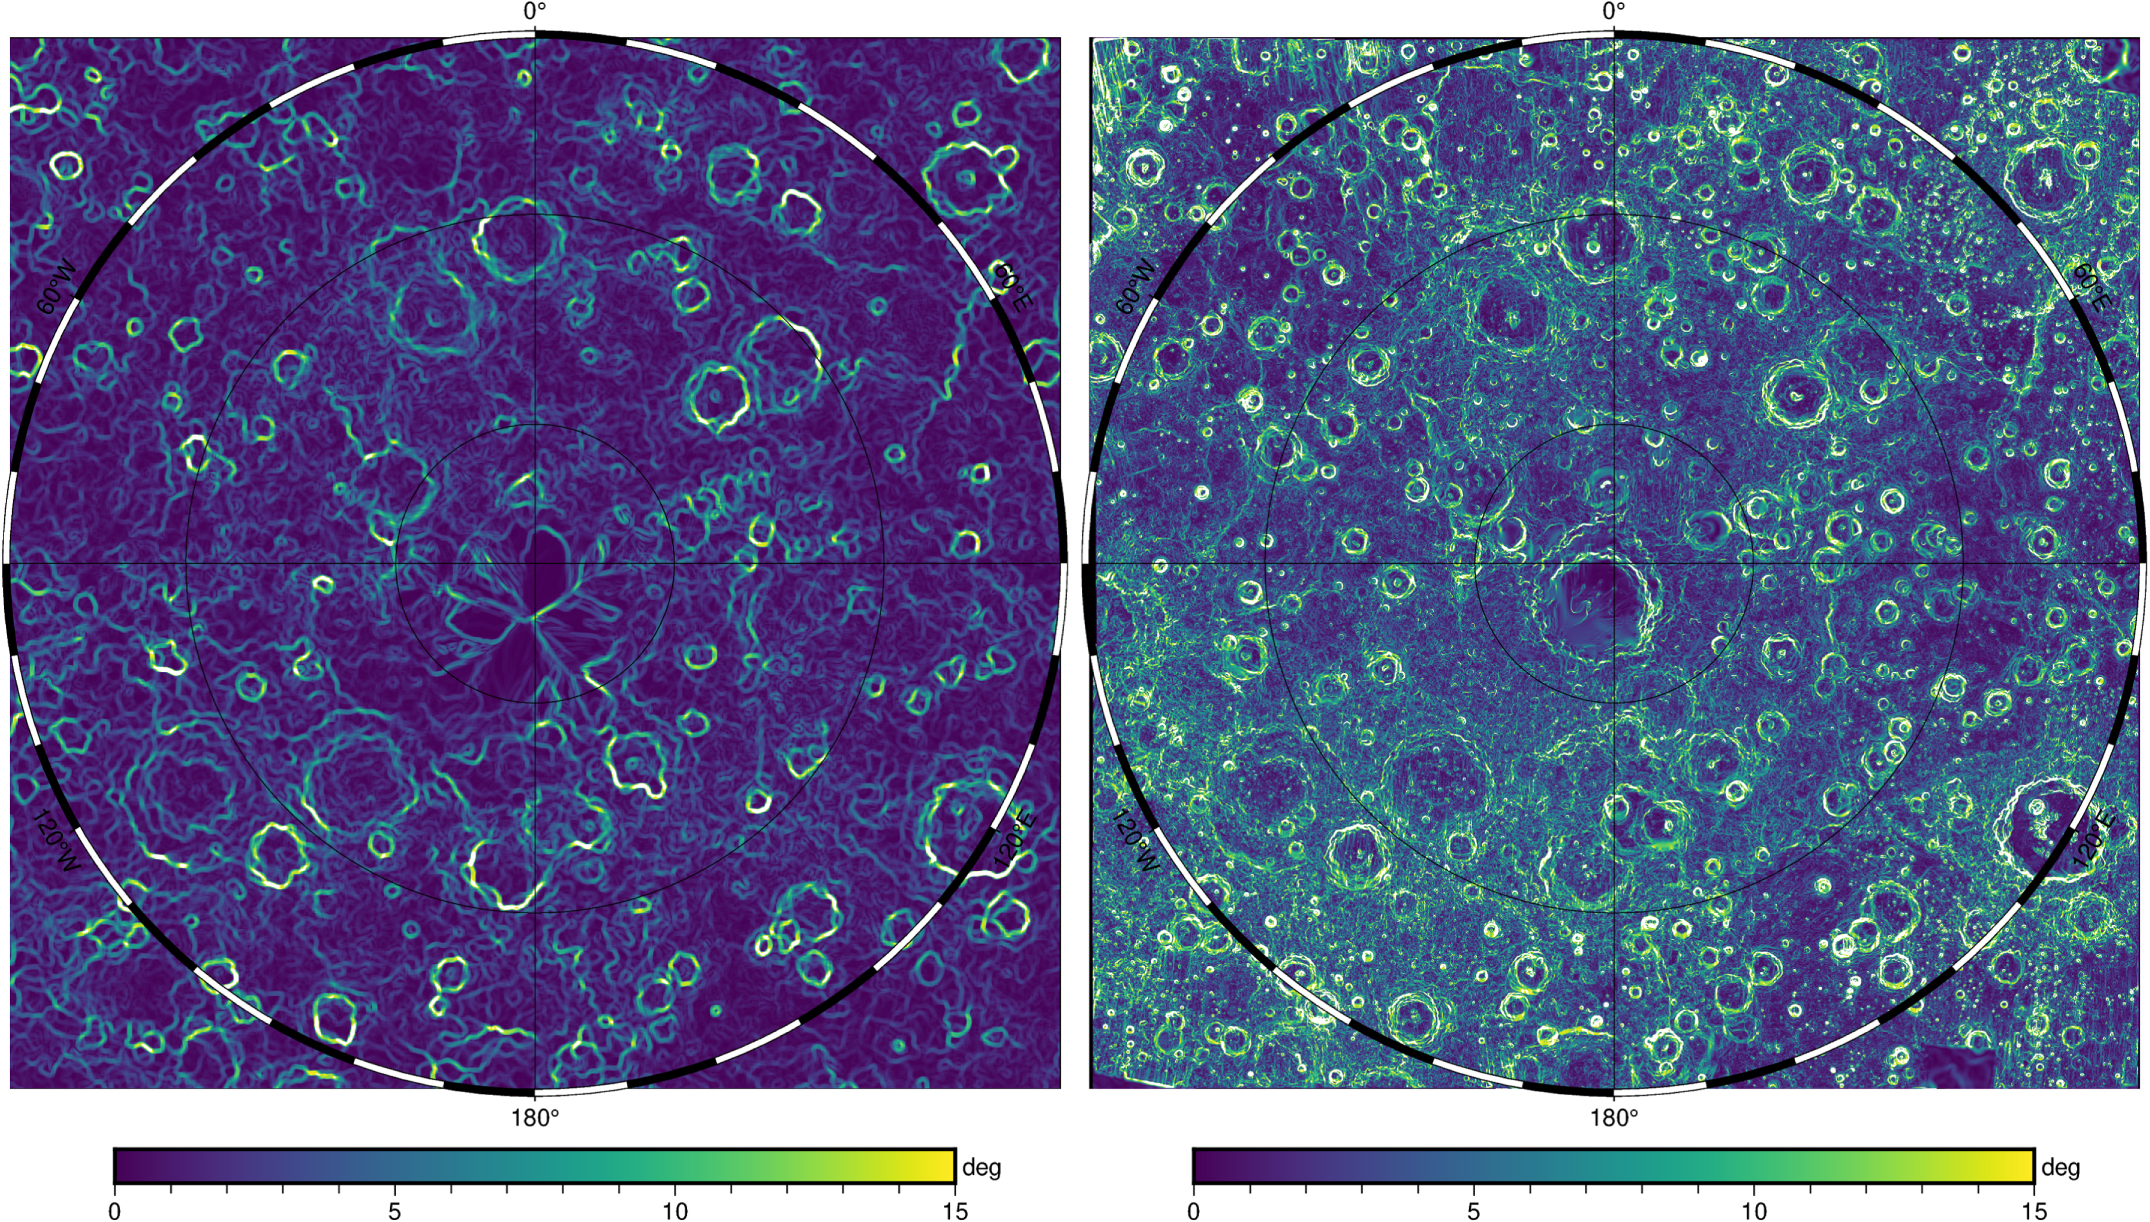
Slopes computed for Mercury’s south polar region from the U.S. Geological Survey (USGS) digital elevation model (DEM) at 665 meter-per-pixel resolution (left) and from NASA’s new 250 meter-per-pixel resolution DEM based on Shape-from-Shading techniques (right). The new NASA model shows many more detailed features and smaller craters, which are key to determining reliable Sun illumination and thermal conditions at the surface. Figure from Bertone et al., 2023.
Bertone and colleagues are not finished with MESSENGER’s dataset yet. For one, “we will be refining our current topography model in areas of particular interest for the presence of ice and other volatiles,” Bertone said. “We also will be doing thermal modeling and new analyses of Earth-based radar observations using novel, AI-based approaches on Explore/ADAPT.”
In a few years, these researchers will have new datasets to study. Now on its way to Mercury is the European Space Agency-Japan Aerospace Exploration Agency BepiColombo mission. After arrival in December 2025, routine science operations are expected to begin in February 2026. BepiColombo’s nearly 30 sensors include a laser altimeter and multiple cameras with unprecedented resolutions. For example, the laser altimeter will observe both hemispheres at 100-meter-per-pixel resolution, “further improving our global understanding of Mercury’s origin and evolution,” Bertone said.
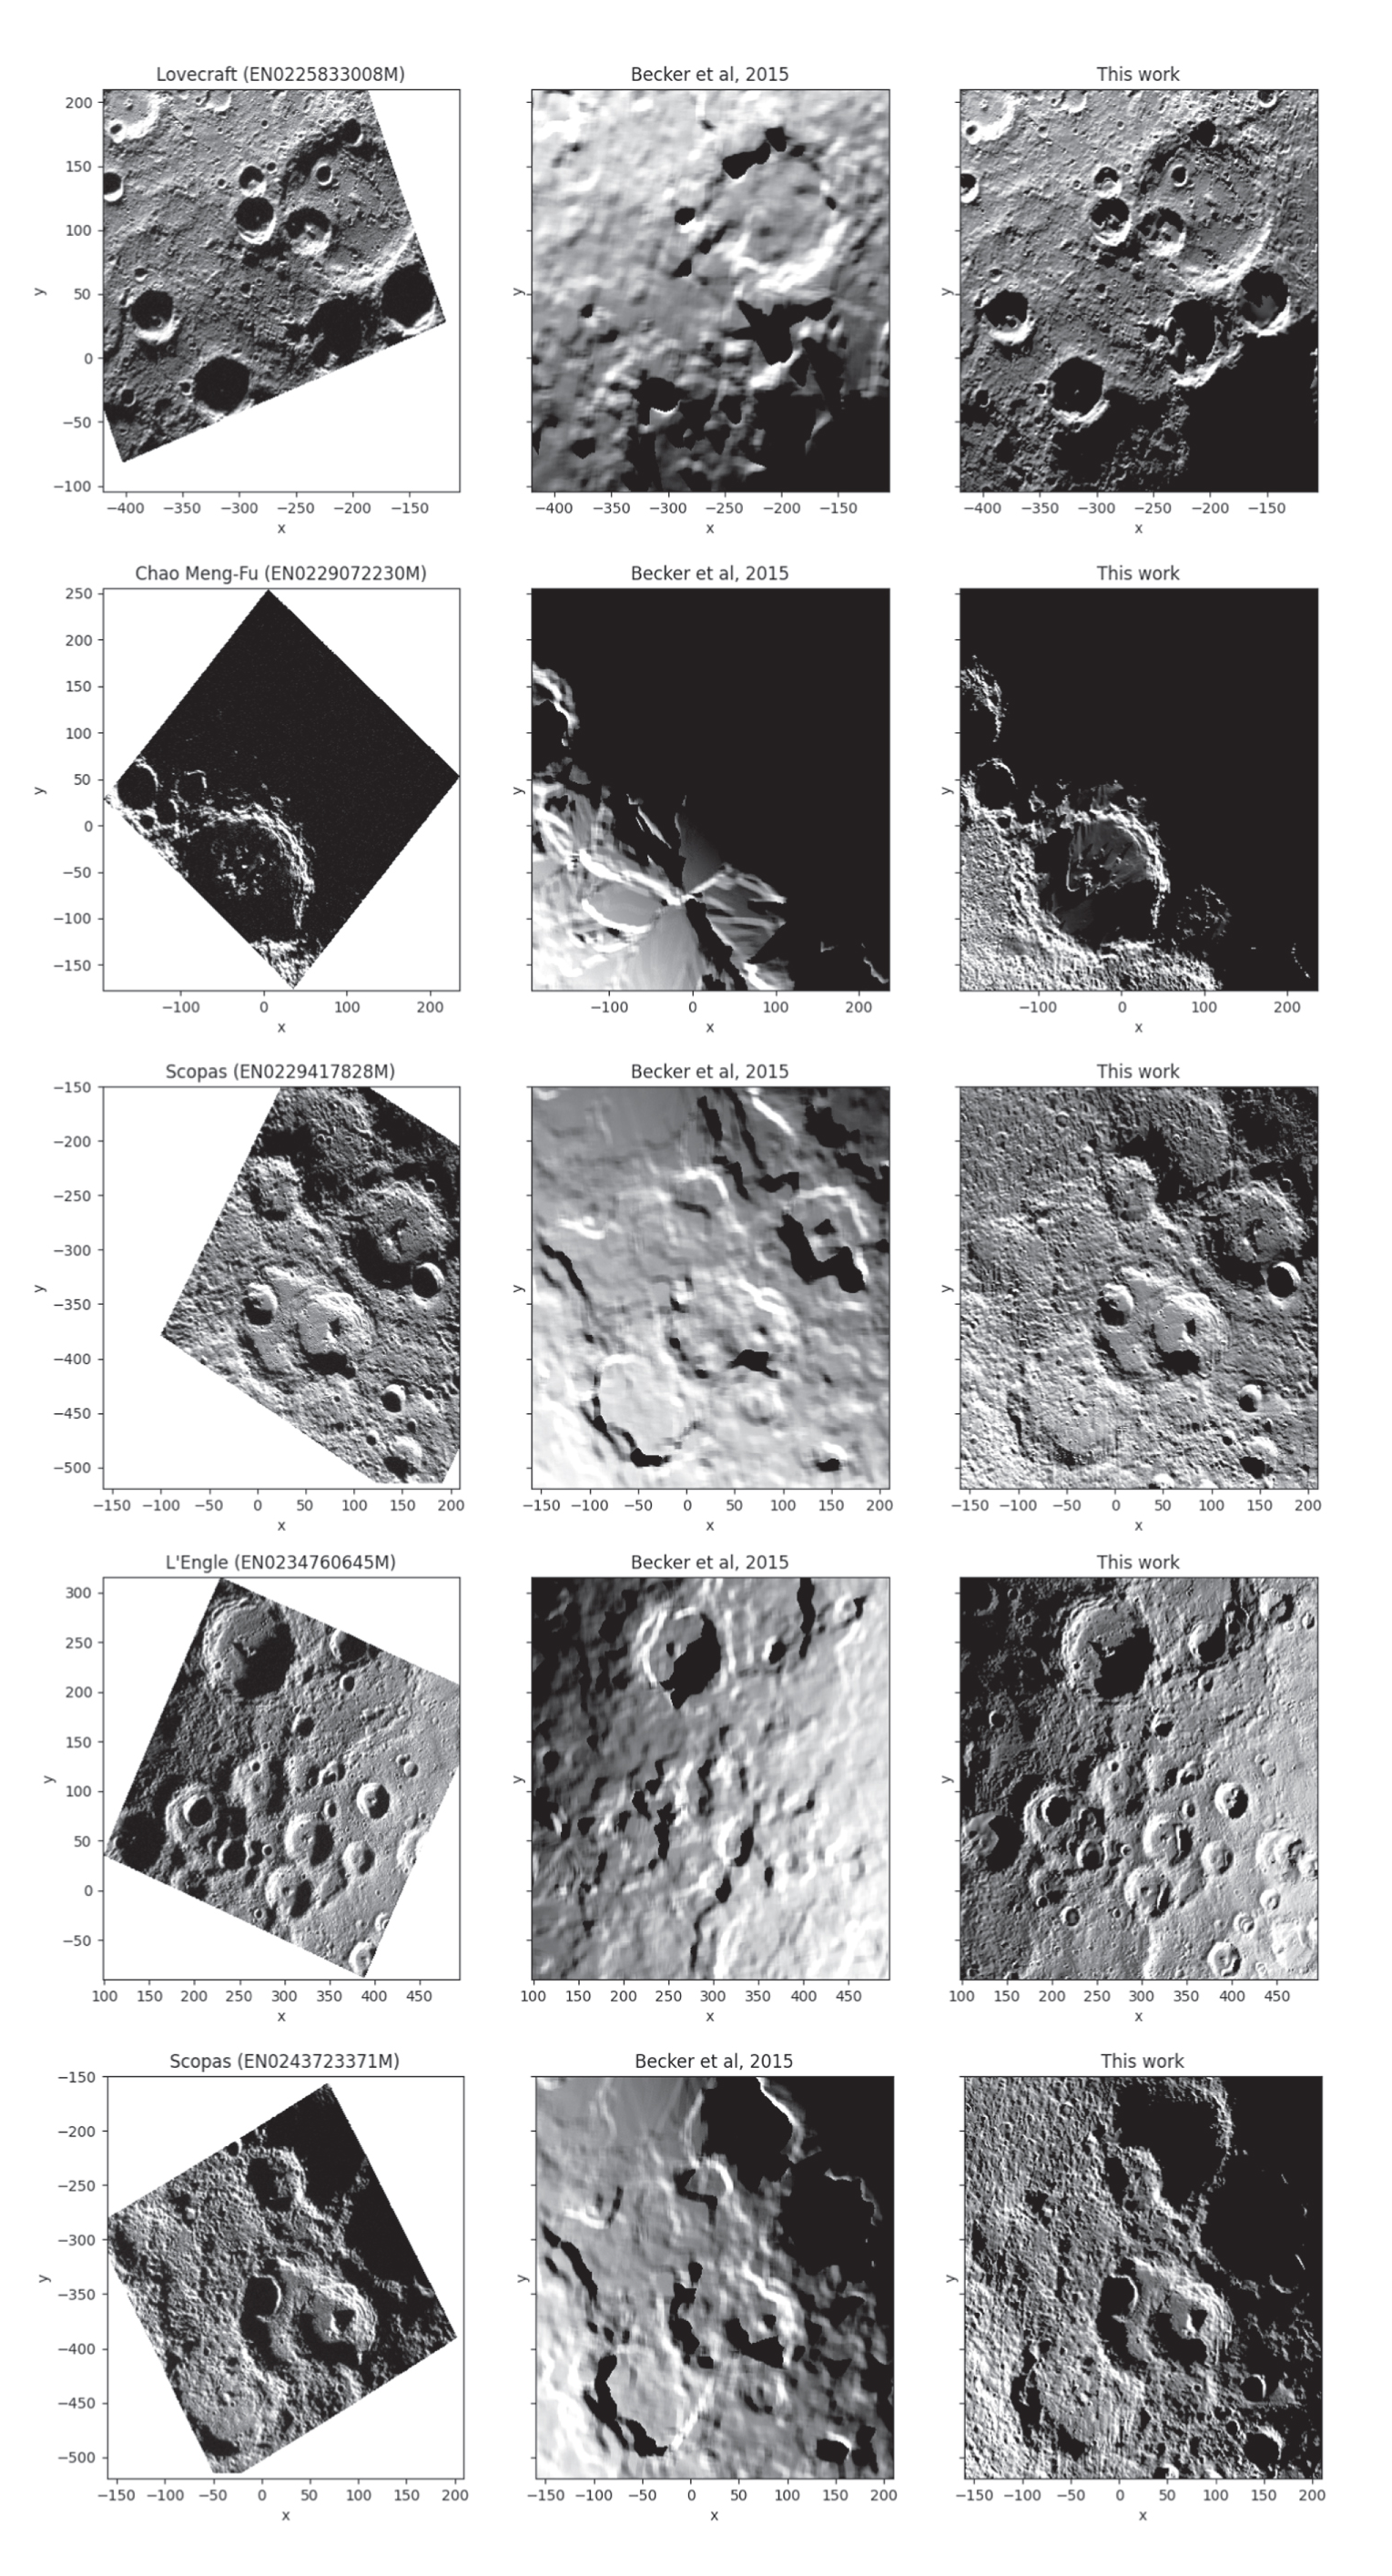
This series shows Mercury Dual Imaging System-Narrow Angle Camera (MDIS-NAC) images at several south polar locations (left) along with their rendering with direct Sun illumination based on the USGS DEM (center) and the new NASA DEM (right). The NASA DEM is a much better match with the MDIS-NAC images, when consistently illuminated, which validates the product and highlights potential uses for future studies. Figure from Bertone et al., 2023.
RELATED LINKS
- Bertone, S., E. Mazarico, M.K. Barker, M.A. Siegler, J.M. Martinez-Camacho, C.D. Hamill, A.K. Glantzberg, and N.L. Chabot, 2023: Highly Resolved Topography and Illumination at Mercury’s South Pole from MESSENGER MDIS-NACM. The Planetary Science Journal, 4, no 21, doi:10.3847/PSJ/acaddb.
- “NCCS ADAPT Science Cloud Helps Reveal Mercury’s Mysteries,” NCCS Highlight, October 29, 2021.
- “First Global Topographic Model of Mercury,” NASA Scientific Visualization Studio, October 14, 2016.
- Becker, K.J., M.S. Robinson, T.L. Becker, L.A. Weller, K.L. Edmundson, G.A. Neumann, M.E. Perry, and S.C. Solomon, 2016: First Global Digital Elevation Model of Mercury. Proceedings, 47th Lunar and Planetary Science Conference, 2959.
Jarrett Cohen, NASA Goddard Space Flight Center
July 25, 2023