
NASA Center for Climate Simulation


High Performance Computing for Science
  • HOME
  • USERS
    • Portals
    • Account Help
    • User Events
    • Instructionals
  • SERVICES
    • High Performance Computing
    • Cloud Computing
    • Analytics
    • Visualization
    • Data Sharing & Tools
    • Climate Data Services
  • SYSTEMS
    • System Status
    • Discover
    • ADAPT
    • Storage Systems
    • DataPortal
    • Hyperwall
    • Remote Visualization
  • SCIENCE & TECHNOLOGY
  • NEWS & EVENTS
    • Events and Conferences
  • ABOUT US
    • NCCS Emblem

Search form

Alert

Due to the lapse in federal government funding, NASA is not updating this website. We sincerely regret this inconvenience.

  • NEWS & EVENTS HOME
  • NCCS HIGHLIGHTS
  • EVENTS & CONFERENCES
  • NCCS IN THE NEWS

// NCCS in the News

Plots comparing the performance of the proposed air quality forecasting method (solid lines) to the best of two baseline methods (dotted lines)

GMAO Science Snapshot: Sub-city Scale Hourly Air Quality For...

Thursday, September 30, 2021 - 13:41
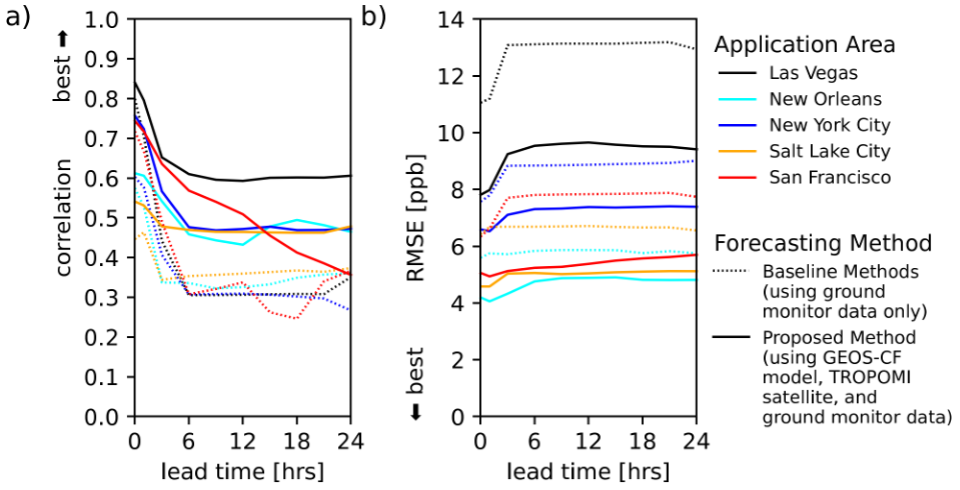
To better understand air quality risks and mitigate impacts, Global Modeling and Assimilation Office (GMAO) scientists propose a method incorporating outputs of NASA’s GEOS Composition Forecasting (...
READ MORE
Visualization of air temperature anomaly, ice surface melt extent, and 500 mPa height during peak melt extent on Greenland

GMAO Science Snapshot - 2021 Greenland Ice Sheet Melt Events...

Wednesday, September 1, 2021 - 12:37
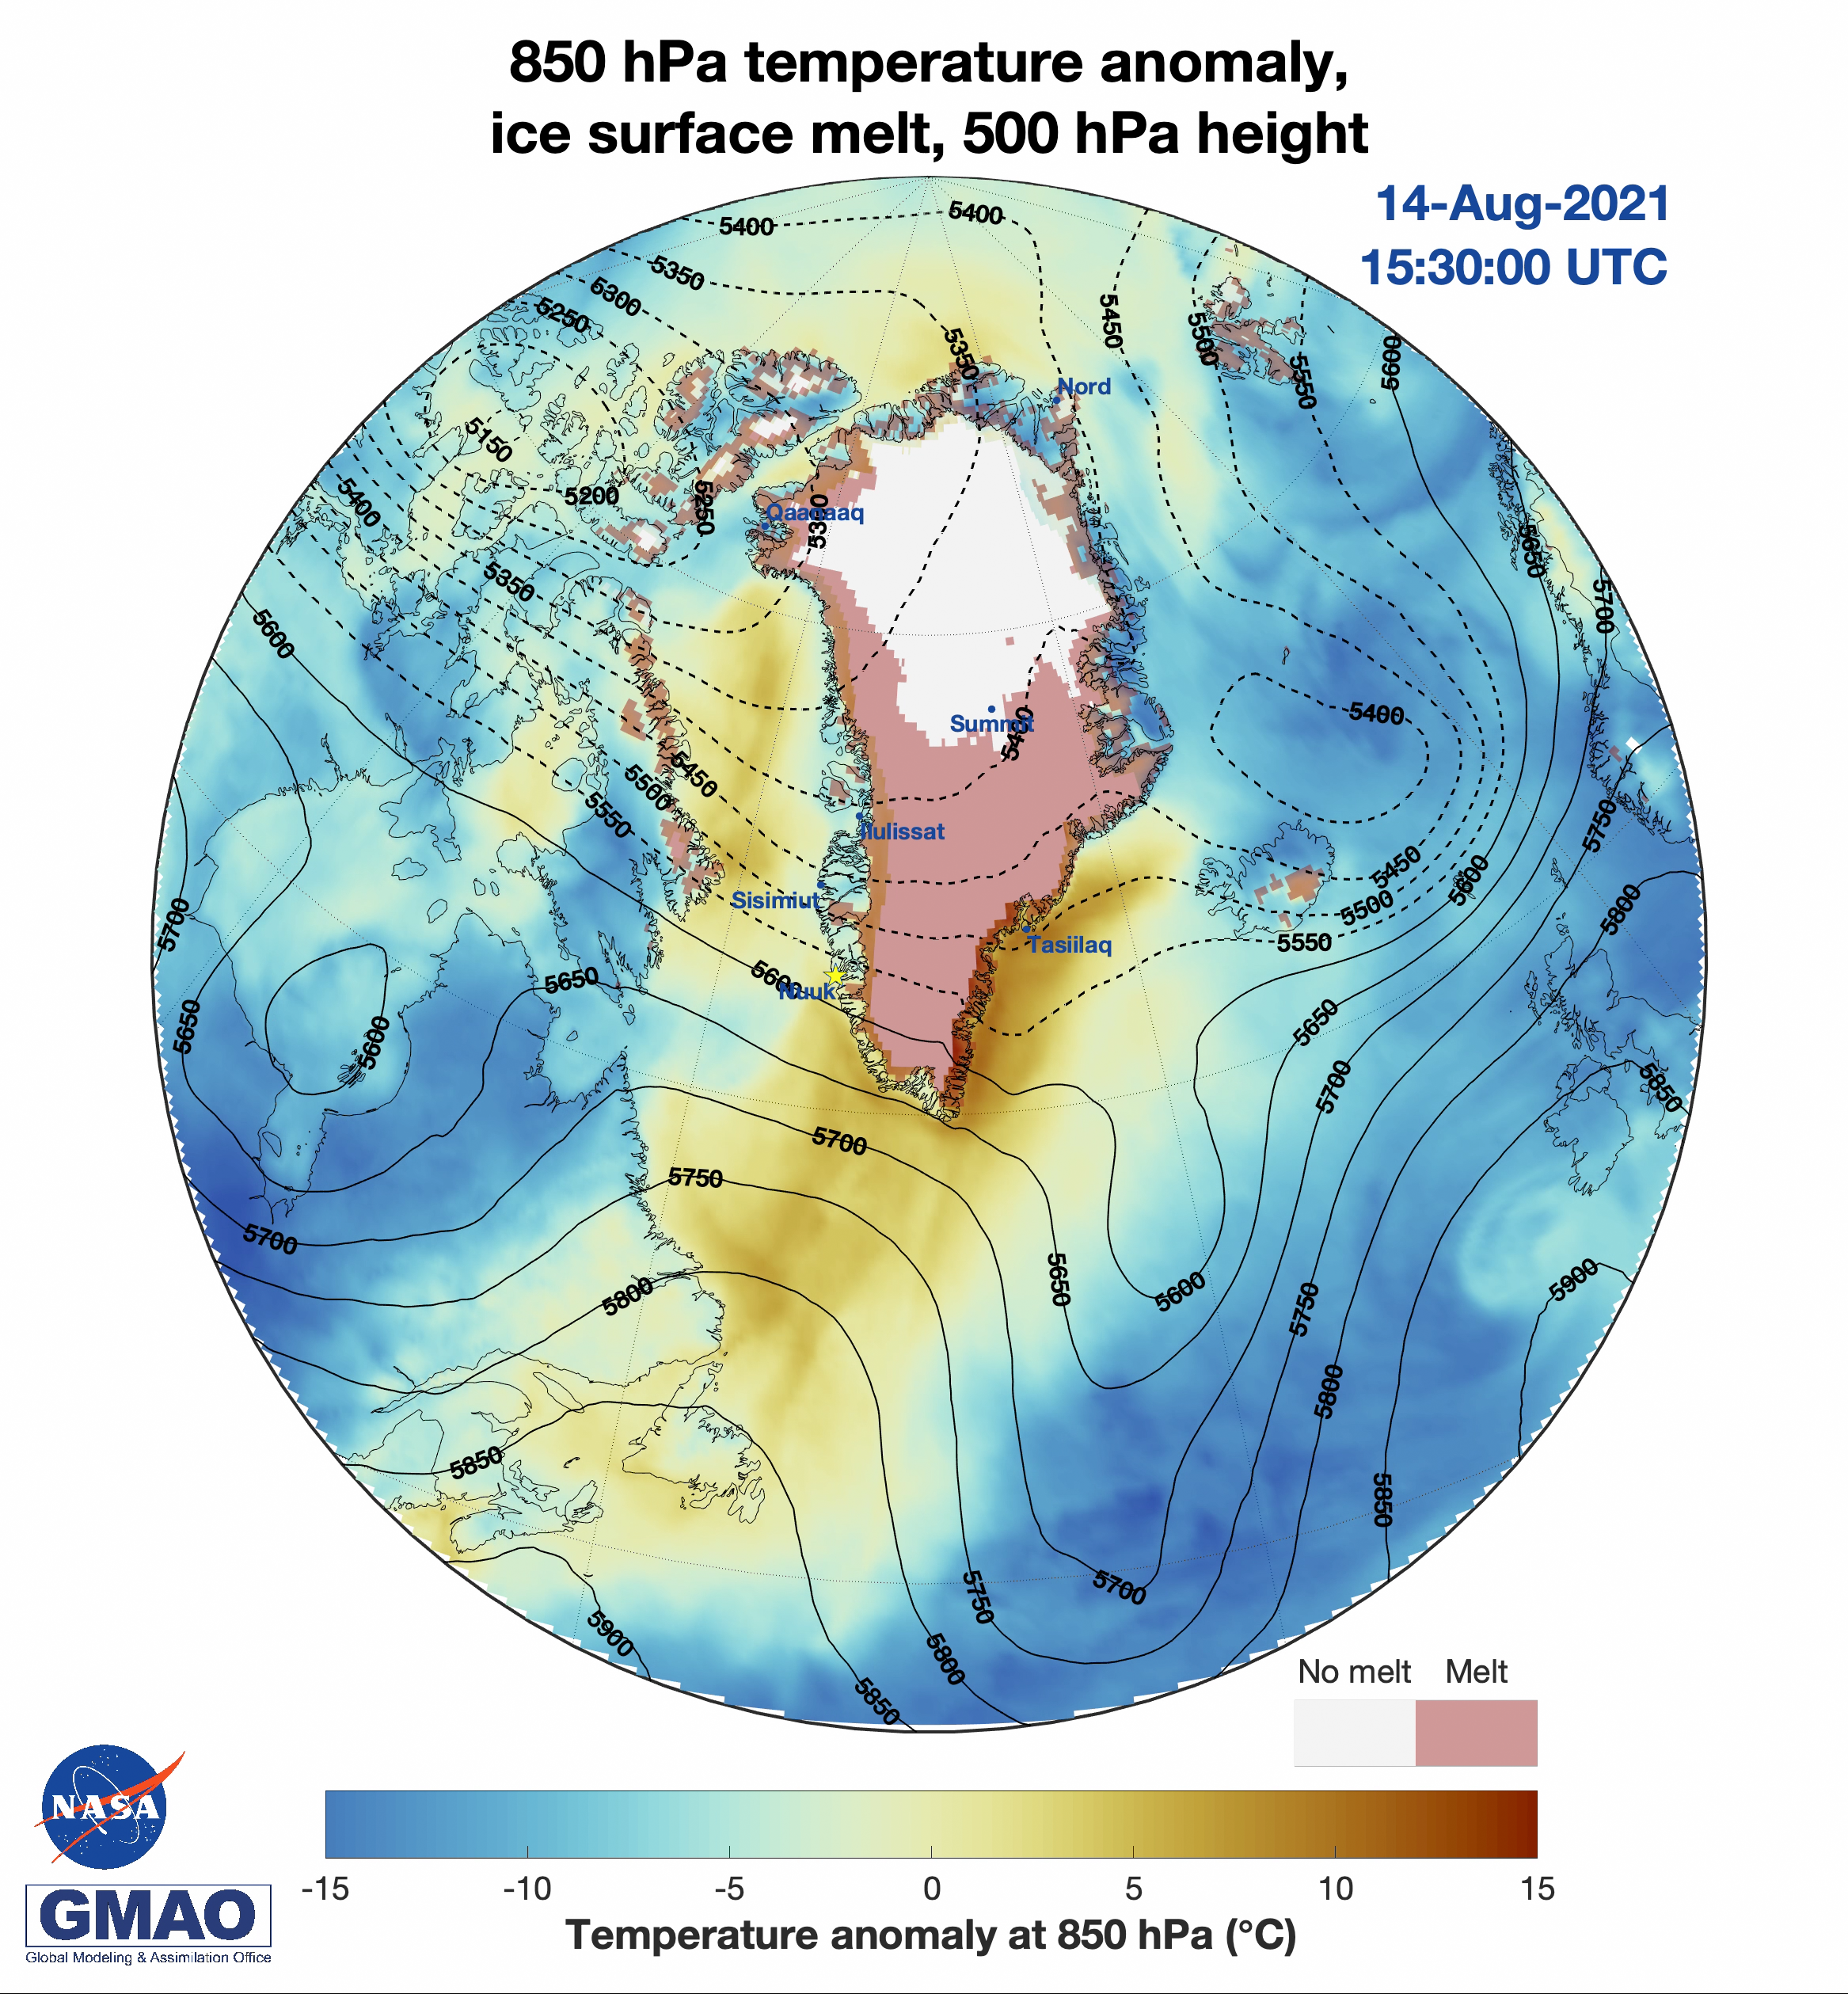
The summer of 2021 is remarkable for a series of late-summer melt events that have covered large areas of the Greenland Ice Sheet, even extending to its highest point at Summit Station. These events...
READ MORE
Spatial pattern of near-surface temperature anomaly of June 2021 relative to 1981–2020 over the western U.S.

GMAO Snapshot – The Abnormally Hot June 2021 in the Western...

Thursday, August 26, 2021 - 14:00
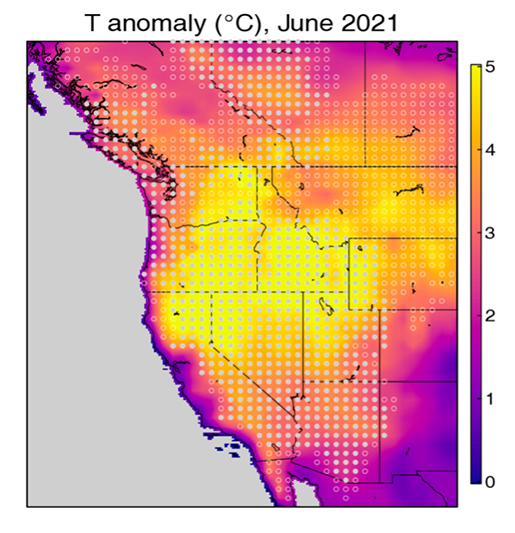
An extreme heat wave occurred over much of the western U.S. and southwestern Canada in late June 2021. The Global Modeling and Assimilation Office (GMAO) used daily and monthly near-surface...
READ MORE
Map of aerosol optical depth due to black and organic carbon over North America at 6 UTC on July 21, 2021

GMAO Science Snapshot: An Early Start to the North American...

Monday, August 2, 2021 - 16:57
The GEOS FP weather analysis and forecasting system shows the long-distance pollutant transport from Western North American wildfires in July 2021. GEOS-FP runs four times per day at the NASA Center...
READ MORE
Visualization of potential vorticity and temperature over North America

GMAO Science Snapshot: A Dynamical View of the Record Heatwa...

Thursday, July 15, 2021 - 12:09
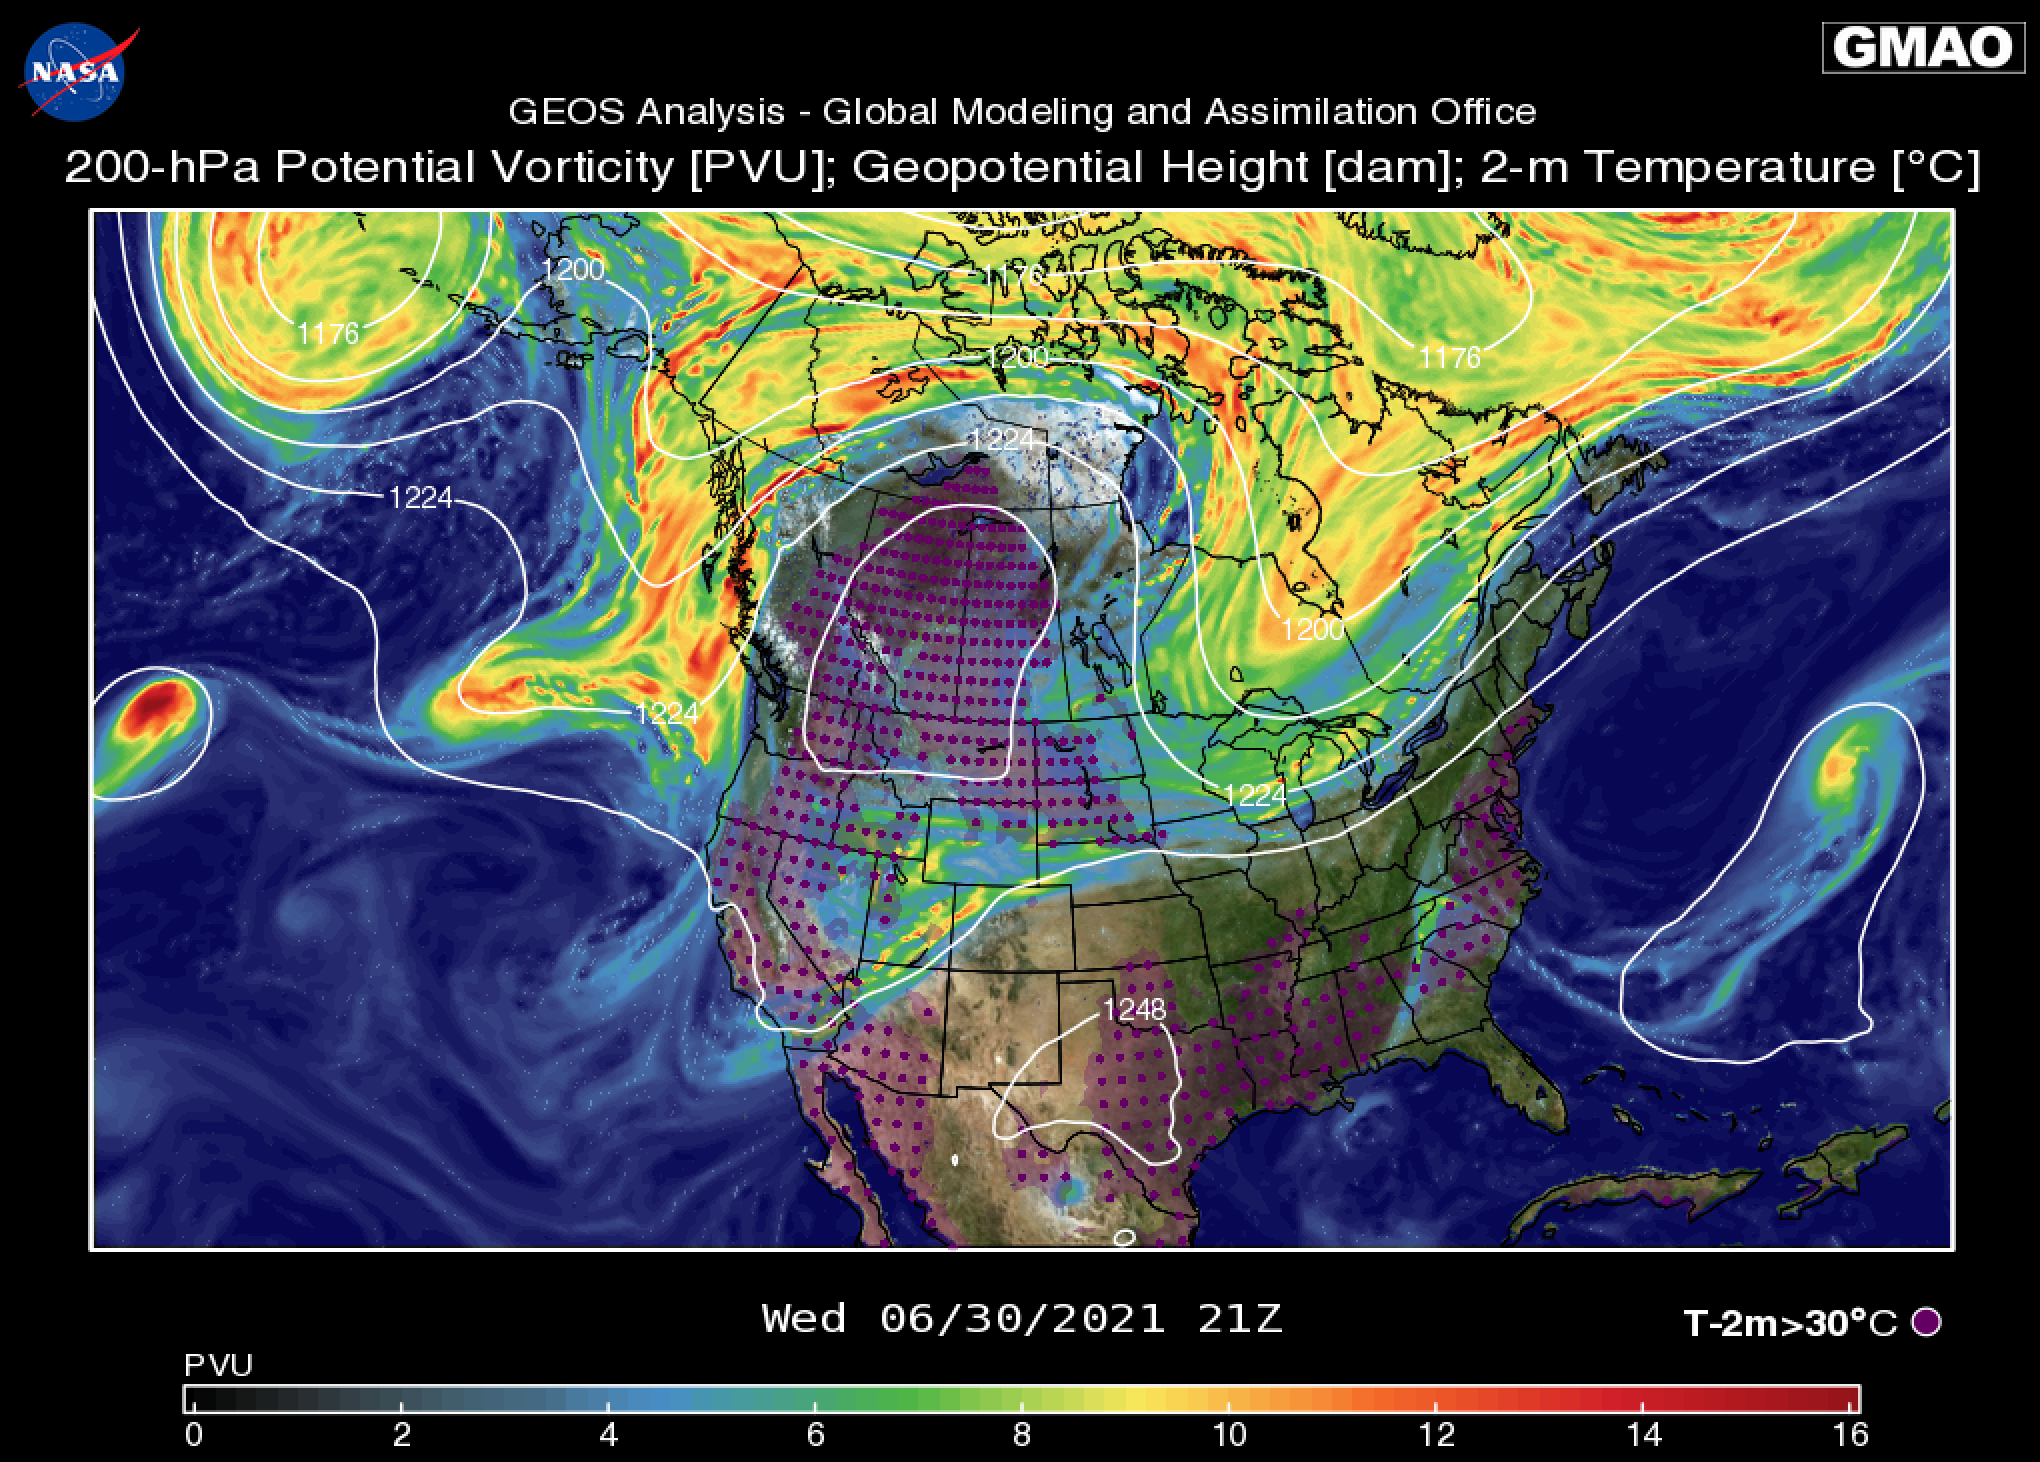
During the last week of June 2021, an unprecedented heat wave engulfed the U.S. Pacific Northwest and British Columbia, Canada.
READ MORE
Visualization of ozone during sudden stratospheric warming over Antarctica

GMAO Science Snapshot: The Anomalous 2019 Polar Stratospheri...

Wednesday, June 30, 2021 - 10:30
At the end of August 2019, a rare sudden stratospheric warming commenced in the Southern Hemisphere as a result of anomalously high wave activity.
READ MORE
Map of potential landslide risk output by NASA’s Landslide Hazard Assessment Model in June 2021

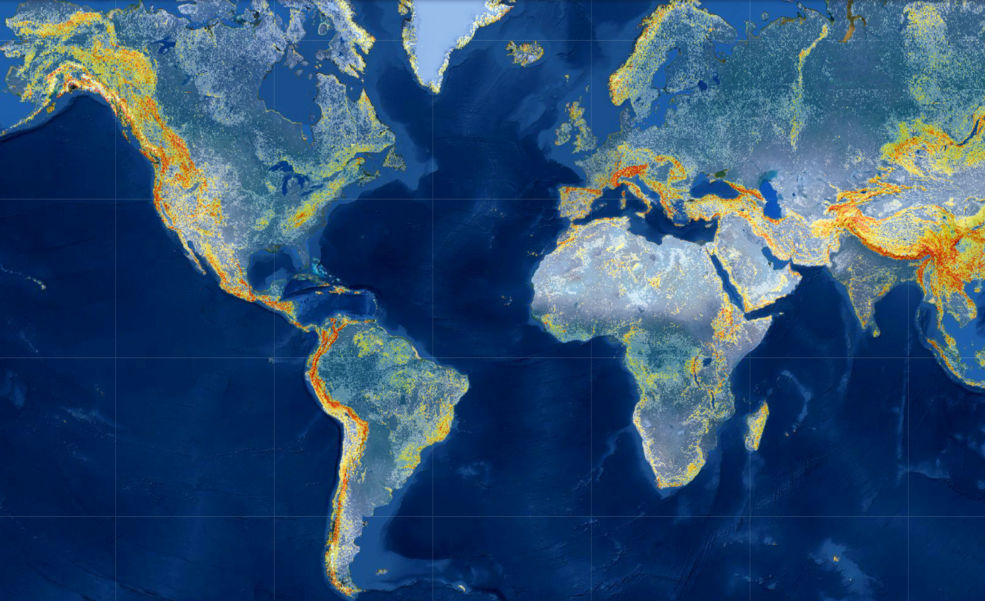
Machine Learning Model Doubles Accuracy of Global Landslide...

Friday, June 11, 2021 - 13:02
What if we could identify at-risk areas anywhere in the world at any time?
READ MORE
World map comparing GEOS-CF forecasts and GAW observations

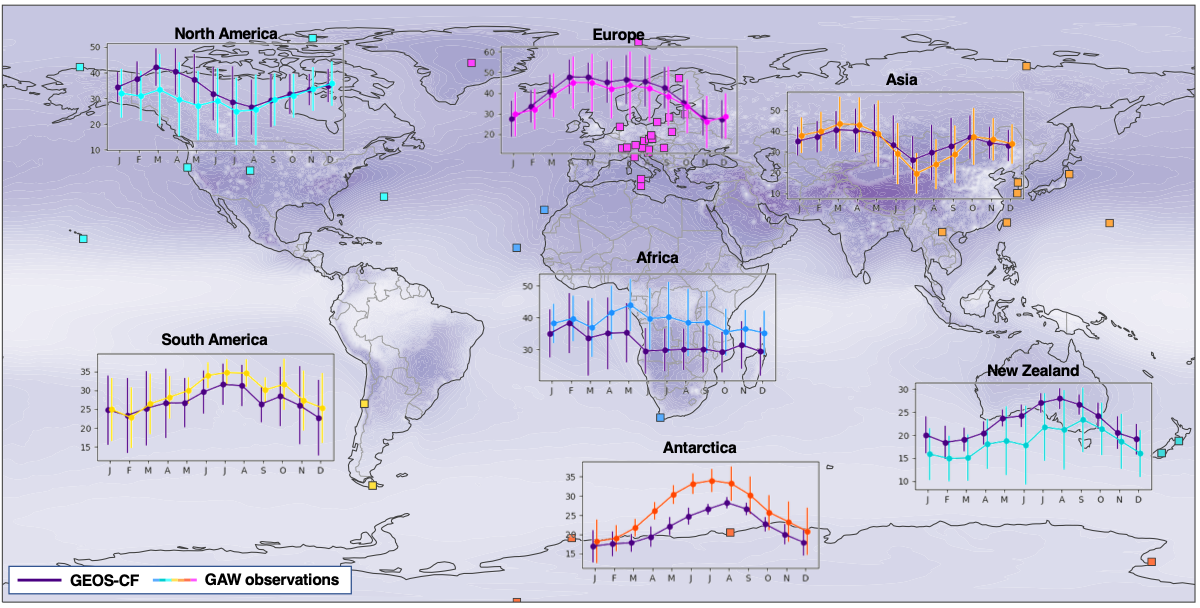
GEOS-CF Surface Ozone Compares Well Against Background Obser...

Tuesday, April 27, 2021 - 11:59
Comparisons against observations from the GAW network highlight that NASA’s GEOS composition forecast system (GEOS-CF) captures much of the observed spatial and temporal variability of surface ozone.
READ MORE
Observed (left) and model (right) precipitation anomaly for June, July, and August from the March forecast

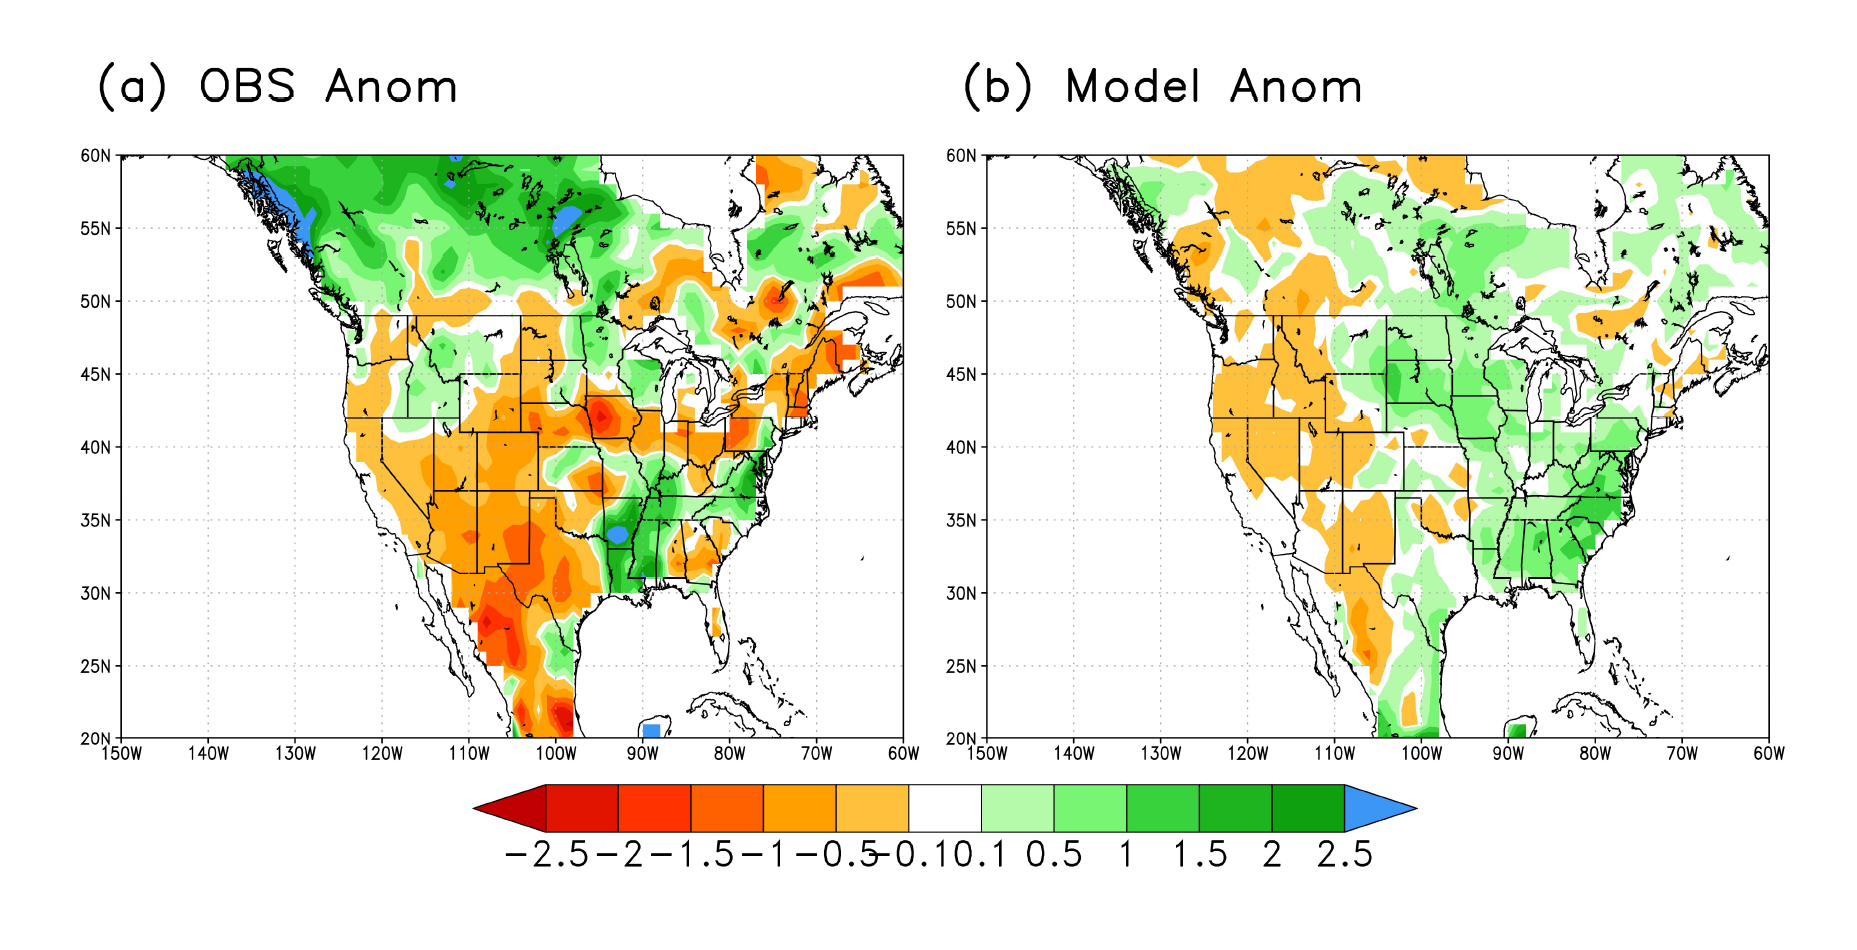
GEOS-S2S Predicted 2020 Summertime Precipitation Anomalies T...

Friday, April 23, 2021 - 09:17
The GEOS-S2S-V2 running at the NCCS forecasted a persistent negative precipitation anomaly on the west coast three months ahead of time and with high probability.
READ MORE
Visualization of two orbiting supermassive black holes

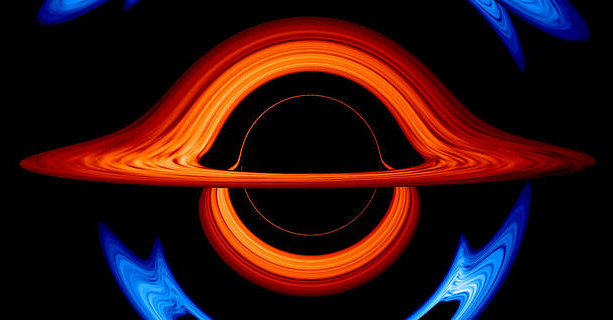
New NASA Visualization Probes the Light-bending Dance of Bin...

Friday, April 16, 2021 - 09:56
A pair of orbiting black holes millions of times the Sun’s mass perform a hypnotic pas de deux in a new NASA visualization created at the NASA Center for Climate Simulation (NCCS).
READ MORE

Pages

  • « first
  • ‹ previous
  • …
  • 3
  • 4
  • 5
  • 6
  • 7
  • 8
  • 9
  • 10
  • 11
  • …
  • next ›
  • last »

NCCS CONTACTS

Curator: Rey Presno
NASA Official: Laura Carriere
High-Performance Computing Lead 
GSFC Code 606.2 
NASA Privacy Policy & Important Notices 
NASA Accessibility Statement 
CISTO

ABOUT US

The purpose of the NCCS is to enhance NASA capabilities in Earth Science, with an emphasis on weather and climate prediction, and to enable future scientific discoveries that will benefit humankind. 


CONTACT US

NASA Center for Climate Simulation
Building 28 Goddard Space Flight Center

Greenbelt, Maryland 20771
NCCS User Service Group
(301) 286-9120

Copyright © 2025 NASA Center for Climate Simulation. All Rights Reserved | Designed by Colton Weinman