NCCS Hosts Modeling Analysis of Carbon Uptake
by Global Boreal Forests
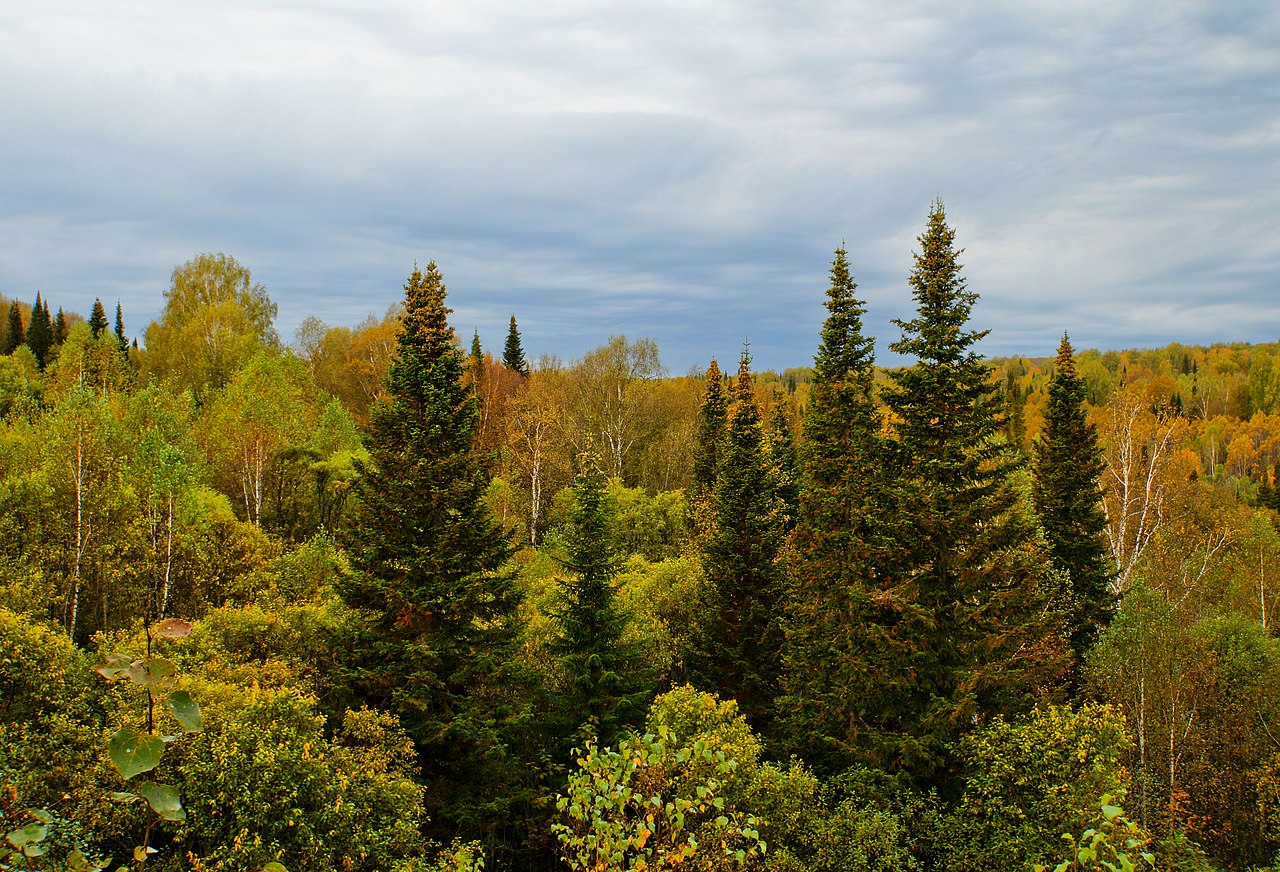
This mixed forest in southern Siberia, Russia, is part of a vast expanse of forests across Earth’s Arctic-boreal region. A recent study led by Woodwell Climate Research Center combined observations with a computer model to estimate carbon uptake by global Arctic-boreal forests. The study shows that Siberian forests like this one are among the most effective at storing carbon. Photo by Anatoly Bortnikov, CC BY 2.0, via Wikimedia Commons.
According to NASA research, summer 2023 was Earth’s hottest since global records began in 1880. In this changing climate, the Arctic and boreal region is experiencing the strongest warming trends – close to four times the global average.
“This warming is having profound (often contrasting) impacts on the landscape and carbon cycle,” said Jennifer Watts, Assistant Scientist at Woodwell Climate Research Center in Falmouth, Massachusetts. For instance, “permafrost and seasonally frozen soils in this region hold more carbon than is currently in the entire atmosphere,” she said. As these soils thaw in warmer temperatures, solid carbon stored in them can become food for microbes and get converted into carbon dioxide or methane gas. “Adding these additional sources of carbon dioxide or methane into the atmosphere is very bad for our Earth because it further accelerates climate change, including the warming of Arctic-boreal regions,” Watts said.
On the other hand, “warming in conjunction with balanced water soil conditions – not too dry (more drought) and not too wet (more methane production) – can lead to more productive plants and more uptake of carbon dioxide,” she explained.
To better understand the complexities of carbon uptake across the Arctic-boreal region, Watts, Woodwell Climate Research Assistant Fellow Mary Farina, and 36 scientists from more than 20 institutions worldwide mounted a global-scale study. The researchers combined multiple observational datasets, a computer model, and NASA Center for Climate Simulation (NCCS) computing resources to estimate carbon uptake by all Arctic-boreal forests.

Lead study authors were (left to right) Jennifer Watts and Mary Farina of Woodwell Climate Research Center, with 36 additional collaborators at more than 20 institutions worldwide.
“It takes a community to advance knowledge! This study builds upon decades of work provided by numerous scientists within the U.S. and international communities who have focused on Arctic field research, ecosystem modeling, and the technology advances needed to make this project happen,” Watts said. The study appears in the journal Global Change Biology.
The study area encompasses 19.7 million square kilometers, essentially all the land starting at 50 degrees north latitude. The Arctic-boreal region stretches across the northernmost sections of Asia, Europe, and North America. It includes a variety of landscapes, from barren to tundra to evergreen needleleaf forest (see the map below).
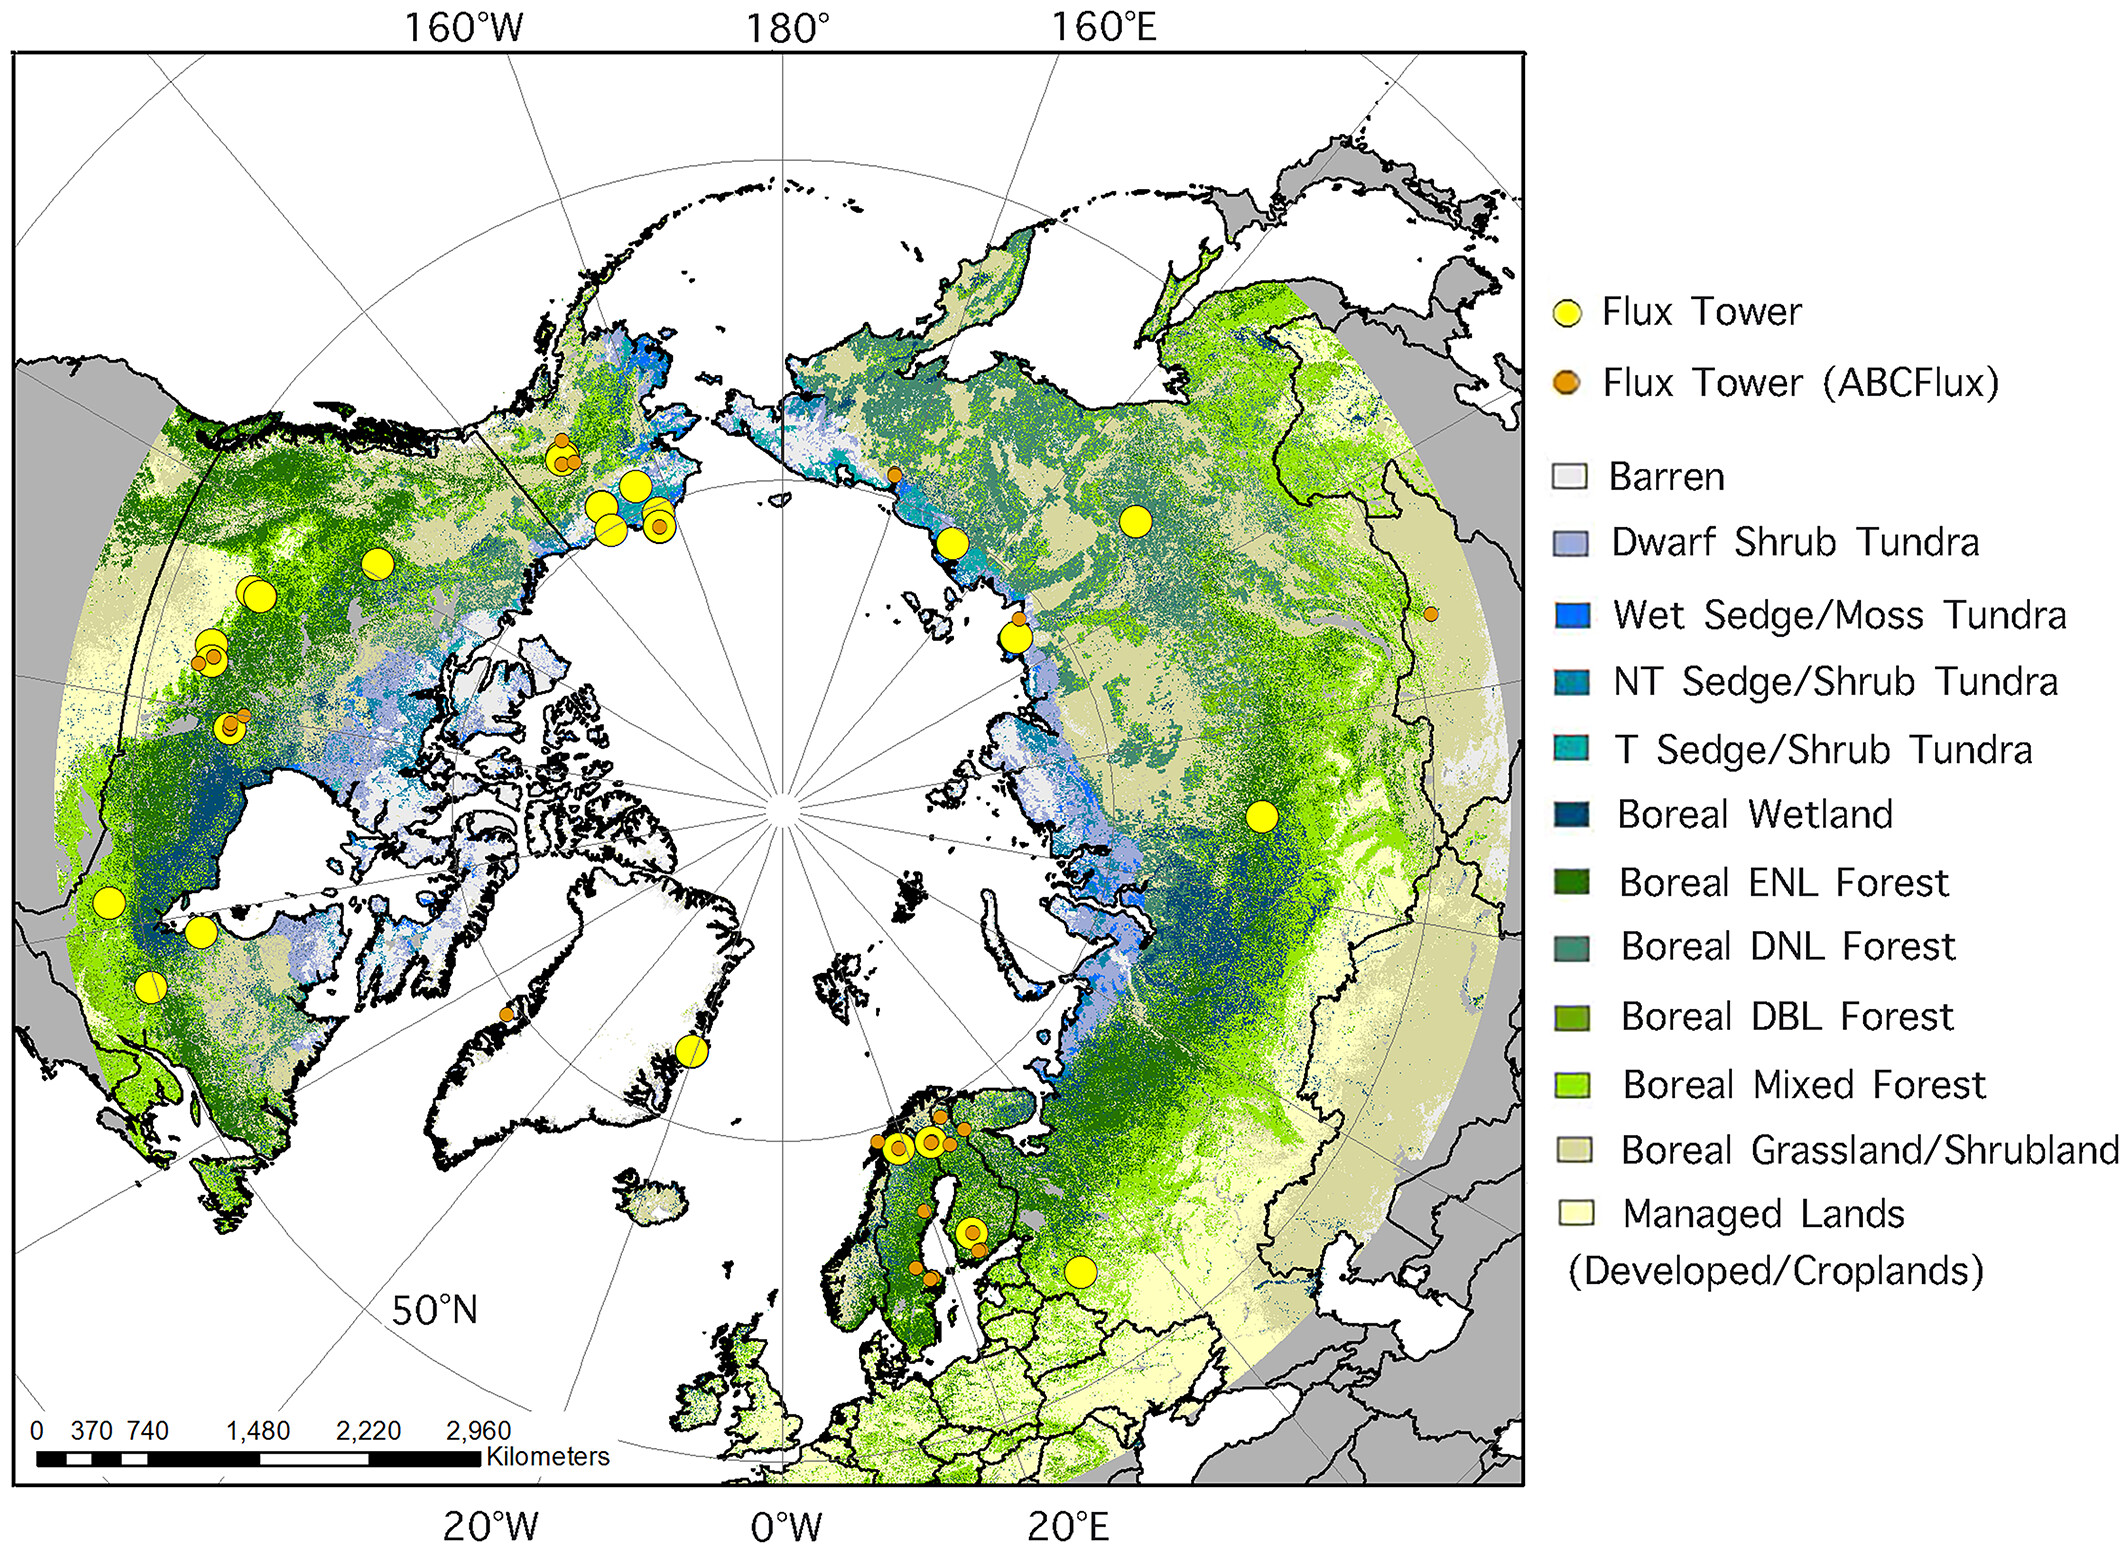
The map shows the study area encompassing terrestrial landscapes within Earth’s Arctic-boreal zone, from 50 degrees north latitude and up. Yellow circles show eddy covariance (EC) flux tower sites whose data were incorporated into the TCFM-Arctic model; orange circles denote ABCFlux EC flux tower sites whose data were used as validation. Colored shading shows land cover classes (down to 45 degrees north latitude) including sparse/barren lands, dwarf shrub tundra, wet sedge/moss tundra, non-tussock (NT) sedge/shrub tundra, tussock (T) sedge/shrub tundra, boreal wetland, boreal evergreen needleleaf forest (ENF), boreal deciduous needleleaf and broadleaf forests (DNF and DBL), boreal mixed forest, boreal grassland/shrubland, and managed lands (developed/croplands). Data derived from the merged European Space Agency Climate Change Initiative-Land Cover (ESA CCI-LC 2010; Kirches et al., 2014) and Circumpolar Arctic Vegetation Map (CAVM; Walker et al., 2005). Figure from Watts et al., 2023.
The study investigated the Arctic-boreal region over the years 2003 to 2015. Observational input data came from three primary sources:
- 35 eddy covariance flux towers (see the yellow dots in the map above).
- NASA Global Modeling and Assimilation Office’s MERRA-Land reanalysis (part of a 40+-year dataset computed at NCCS).
- NASA’s Moderate Resolution Imaging Spectroradiometer (MODIS) instrument onboard the Terra and Aqua satellites.
See the table below for the details about data sources, types, and resolution used:
| Data Sources |
Data Types | Data Resolution |
|---|---|---|
| Eddy Covariance Flux Towers |
Water, energy, and carbon exchange between forest and atmosphere |
N/A |
| MERRA-Land Reanalysis | Daily root zone soil moisture Daily near-surface soil temperature Daily near-surface air temperature Daily incoming shortwave radiation Daily wind direction Daily vapor pressure deficit |
1/2 x 2/3 degrees (55 by 74 kilometers at the equator) |
| MODIS Instrument | 4-day fraction of photosynthetically active radiation | 1 kilometer |
“About 20 terabytes of input data were stored at NCCS,” said Mary Farina of Woodwell Climate. “However, the total amount varied over time as we went through various processing steps. For example, when the MERRA input data were resampled to a higher spatial resolution of 1 kilometer, they would become larger files and require more storage space, leading us to use several terabytes multiple times during the data processing and model simulations.”
The observational datasets served as inputs to the Arctic Terrestrial Carbon Flux Model (TCFM-Arctic), which estimates carbon dioxide and methane flux over 1-kilometer grid cells using daily time steps. TCFM-Arctic simulations for the years 2003–2015 ran on the NCCS Explore/ADAPT Science Cloud’s ABoVE Science Cloud nodes serving the Arctic-Boreal Vulnerability Experiment (ABoVE). Whenever possible, the researchers would use all 32 computing cores to distribute the processing tasks. Farina noted that a single core would take approximately a week to simulate each modeled day. Output data was approximately 1.2 terabytes.
“Having access to NCCS supercomputing resources made this project possible. Otherwise, we would have been spending thousands of dollars of valuable (and limited) project funds on commercial cloud computing,” Watts said. “Having ‘no cost’ access to NASA computing allowed us to experiment with multiple alternative model simulations, which better enabled us to identify and minimize sources of error within the regional model runs.”
Farina validated and compared the TCFM-Arctic simulation results with estimates from multiple bottom-up (terrestrial carbon flux) and top-town (atmospheric) models as well as information from 25 eddy covariance flux towers captured in the ABCFlux dataset (see the map above). For this work, she primarily used computing resources at the University of Montana’s Numerical Terradynamic Simulation Group (a NASA Science Compute Facility).

Maps of average annual carbon flux across Arctic-boreal regions for the years 2003–2015 shown by daily 1-kilometer TCFM-Arctic model simulations for (a) vegetation gross primary productivity (GPP); (b) ecosystem respiration (Reco); (c) net ecosystem carbon dioxide (CO2) exchange (NEE); and (d) tundra and boreal wetland methane (CH4) emissions with topographic wetness index information masked. Units are in annual grams per square meter. Figure from Watts et al., 2023.
The validated results show that the Arctic-boreal zone remained a net carbon sink through 2015, even when accounting for methane emissions from wetland and aquatic sources and carbon emissions from fire. “However, the story gets more complicated when we break down carbon budgets into smaller regions,” Watts said. “For example, we found that most of the tundra (non-treed) region ranged from carbon neutral to a net annual carbon source. The same was true for boreal landscapes that have been recently impacted by wildfire.”
Notably, the researchers also discovered that the Arctic-boreal carbon sink is largely being driven by boreal forests in eastern Siberia, more so than boreal forests in North America. “This finding demonstrates that if we global nations do not protect the boreal forests that are a carbon sink, we face a reality where the Arctic-boreal is a net carbon source for our planet,” Watts said.
Impact: With high-latitude regions warming rapidly, understanding whether the Arctic-boreal zone is a net carbon sink or source is needed to inform carbon mitigation policies. Although the full Arctic-boreal zone remained a net carbon sink through 2015, some tundra and boreal landscapes ranged from carbon neutral to net sources.
Farina is currently running TCFM-Arctic model simulations through 2022 on the ABoVE Science Cloud. The more current simulations will provide a time series long enough to start looking at local-to-regional trends in carbon budgets.
“This knowledge is incredibly important because we need it to help inform global plans for carbon mitigation and policies,” Watts said. “If we do not understand how climate warming is impacting the high latitude carbon cycle today, we won’t be able to predict Arctic-boreal carbon budgets under future conditions.”
Maps of average annual carbon flux across Arctic-boreal regions for the years 2003–2015 shown by daily 1-kilometer TCFM-Arctic model simulations for (a) NEE + terrestrial CH4; (b) NEE + terrestrial CH4 + aquatic open water CH4 sources; (c) NEE + terrestrial CH4 + carbon sources from fire; (d) NEE + terrestrial CH4 + aquatic open water CH4 + fire. Units are in annual grams per square meter. See the previous figure caption for the full variable names. Figure from Watts et al., 2023.
RELATED LINKS
- Watts, J.D., M. Farina, J.S. Kimball, L.D. Schiferl, Z. Liu, K.A. Arndt, D. Zona, A. Ballantyne, E.S. Euskirchen, P.W. Parmentier, M. Helbig, O. Sonnentag, T. Tagesson, J. Rinne, H. Ikawa, M. Ueyama, H. Kobayashi, T. Sachs, D.F. Nadeau, J. Kochendorfer, M. Jackowicz-Korczynski, A. Virkkala, M. Aurela, R. Commane, B. Byrne, L. Birch, M.S. Johnson, N. Madani, B. Rogers, J. Du, A. Endsley, K. Savage, B. Poulter, Z. Zhang, L.M. Bruhwiler, C.E. Miller, S. Goetz, and W.C. Oechel, 2023: Carbon Uptake in Eurasian Boreal Forests Dominates the High-Latitude Net Ecosystem Carbon Budget. Global Change Biology, 29, 1870–1889, doi:10.1111/gcb.16553.
- “Scientists Measure Impacts of Fire and Other Disturbances on North American Boreal Forest Biomass,” NCCS Highlight, July 23, 2021.
Jarrett Cohen, NASA Goddard Space Flight Center
September 28, 2023